
Using Power BI to add data to a data model
This section deals with creating relationships and adding more data, specifically measures and calculated columns, using DAX, which allows us to modify and create additional columns that we will need in the dashboard.
When we look at Power BI with the query that we created from the previous section, we can see the name of our table, SalesData, on the right with all of the different fields:
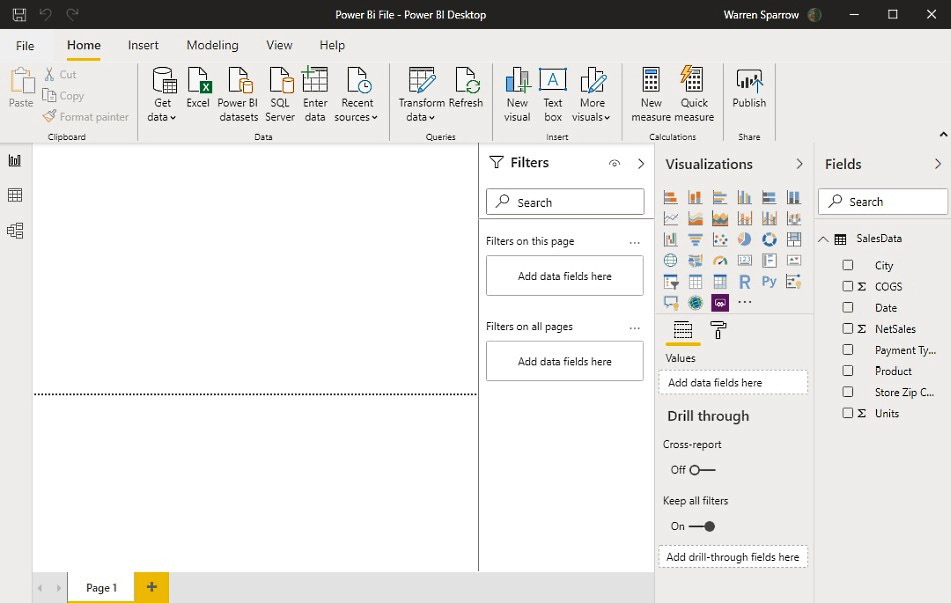
Figure 8.23 – The NetSales table
On closer inspection of SalesData, the ∑ symbol on the left-hand side of some of the fields means that these are numbers. On the left-hand side of the window, we have the Report, Data, and Model views:

Figure 8.24 – The different views
When we first opened Power BI, we were in the Report view by default.
If we click on the Model view, we can see the different relationships that we currently have between our tables. At the moment, we currently...