

Power Query to the rescue
Now that we have created the relationships between our different tables, we will link these tables together. We will need to create a new field called NetIncome in our fRegionSales table. To keep the integrity of the data model, we cannot use Power Pivot to edit the existing data. However, we can create a new calculated column based on our existing data in the table.
Creating a calculated column
Click to select the fRegionSales tab. We are now going to add a column and create a calculated column. Double-click on the next available column on the right that states Add Column and add Net Income. Then, press Enter:
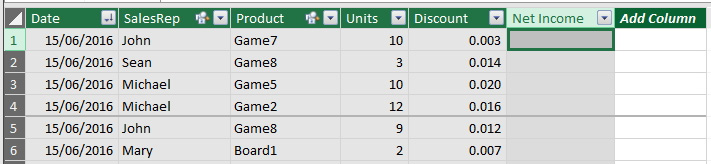
Figure 2.28 – Creating a new column name
Looking at the preceding table, we may want to multiply the units and the discount, along with the unit price, which is in a different table. Normally, we would do a VLOOKUP in Excel to fetch this data. However, VLOOKUP does not exist in Power Pivot. Fortunately, there...