
Grouping data
In this section, we will learn how to group data from a table within Excel Power Query by specifying columns to group by and select the operation to perform as a new column. Group By in Power Query is very much like the Group By option in SQL.
We will use the SalesData1 query to group the region and find the sum aggregate of sales for each region:
- Select the SalesData query in Power Query and duplicate it. Rename the query
SalesGroup. - Click on Home | Group By.
- We will first complete a Basic example. Click on the drop-down list located directly under Basic and make sure Region is selected. Set New column name to
RegionSalesand choose an operation to perform. The column to select to obtain the total sales for each region would be Sales in this case: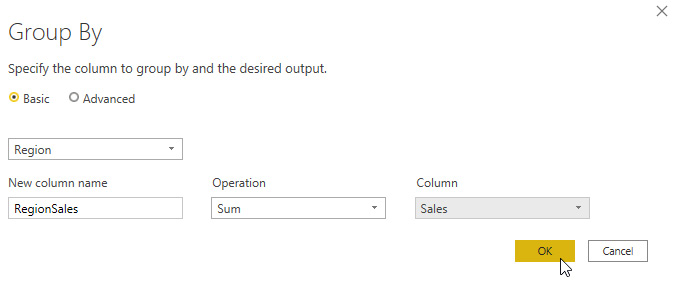
Figure 5.47 – Group By dialog box
- Click on OK to view the result:

Figure 5.48 – Result of sum of sales per region
- Let's see how the Advanced Group By feature works. This time, import...