-
Book Overview & Buying
-
Table Of Contents

-
Feedback & Rating

Enhanced Test Automation with WebdriverIO
By :
Enhanced Test Automation with WebdriverIO
By:
Overview of this book
This book helps you embark on a comprehensive journey to master the art of WebdriverIO automation, from installation through to advanced framework development.
You’ll start by following step-by-step instructions on installing WebdriverIO, configuring Node packages, and creating a simple test. Here you’ll gain an understanding of the mechanics while also learning to add reporting and screen captures to your test results to enhance your test case documentation. In the next set of chapters, you’ll delve into the intricacies of configuring and developing robust method wrappers, a crucial skill for supporting multiple test suites. The book goes beyond the basics, exploring testing techniques tailored for Jenkins as well as LambdaTest cloud environments. As you progress, you’ll gain a deep understanding of both TypeScript and JavaScript languages and acquire versatile coding skills.
By the end of this book, you’ll have developed the expertise to construct a sophisticated test automation framework capable of executing an entire suite of tests using WebdriverIO in either TypeScript or JavaScript, as well as excel in your test automation endeavors and deliver reliable, efficient testing solutions.
Table of Contents (20 chapters)
Preface

Chapter 1: The Utility Belt – Tools Every Superhero SDET Needs
 Free Chapter
Chapter 2: Fortress of Solitude – Configuring WebdriverIO
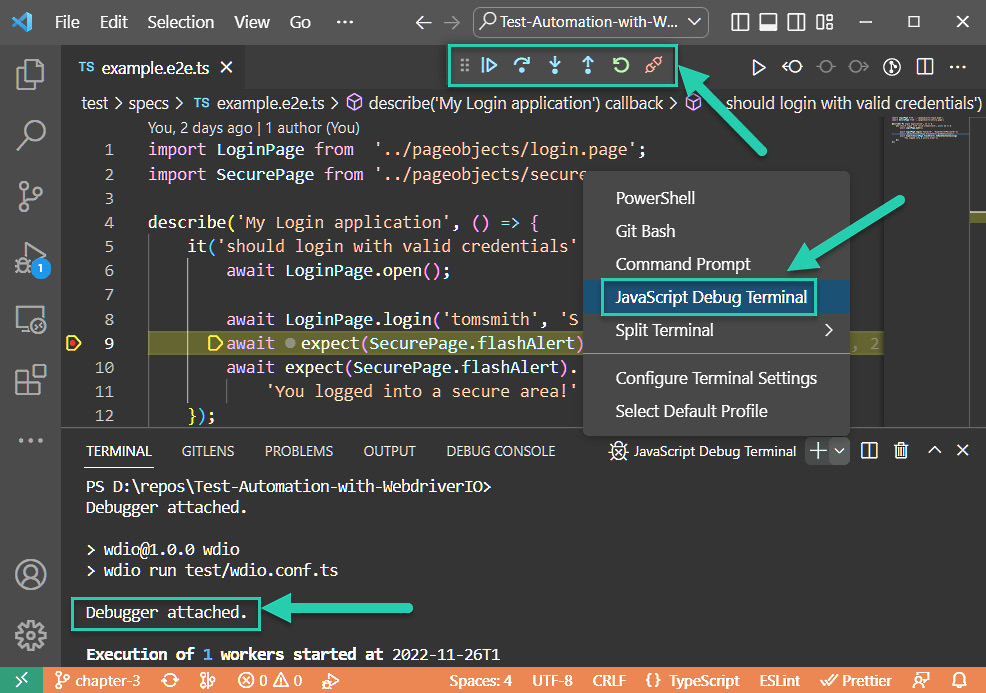
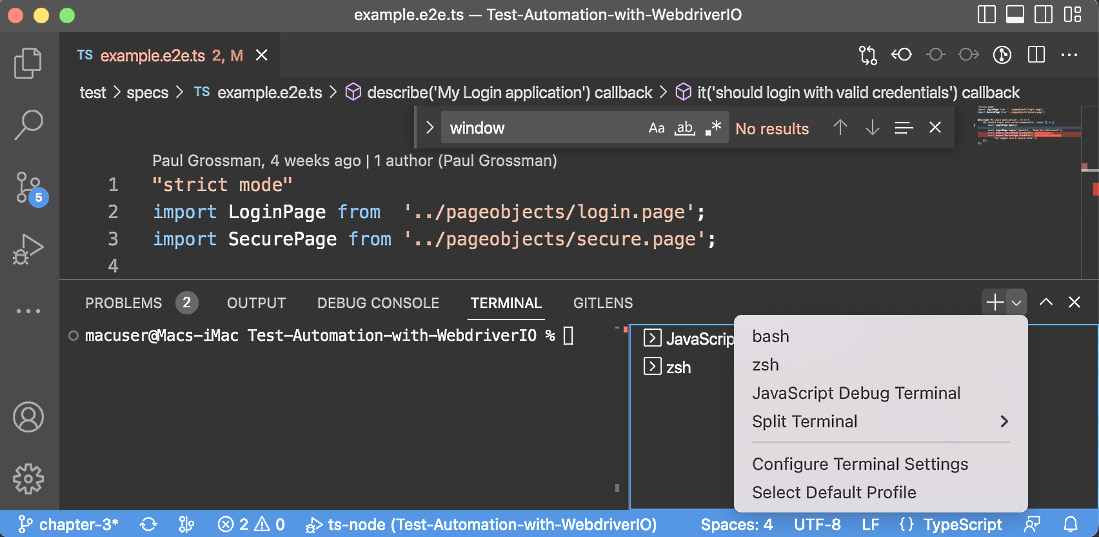
Chapter 3: Cybernetic Enhancements – WebdriverIO Config and Debug Tips
Chapter 4: Super Speed – Time-Travel Paradoxes and Broken Promises
Chapter 5: Alter Egos – The ClickAdv Wrapper
Chapter 6: The setValue Wrapper – Entering Text and Dynamic Data Replacement
Chapter 7: The Select Wrapper – Choosing Values in Lists and Comboboxes
Chapter 8: The Assert Wrapper – the Importance of Embedded Details
Chapter 9: The Ancient Spell Book – Building the Page Object Model
Chapter 10: Increased Flexibility – Writing Robust Selectors and Reducing Maintenance
Chapter 11: Echo Location – Skipping the Page Object Model
Chapter 12: Superhero Landing – Setting Up Flexible Navigation Options
Chapter 13: The Multiverses – Cross-Browser Testing and Cross-Environment Testing
Chapter 14: The Time-Traveler’s Dilemma – State-Driven End to End User Journeys
Chapter 15: The Sentient Cape – Running Tests in a CI/CD Pipeline with Jenkins and LambdaTest
Epilogue
Index
Other Books You May Enjoy
Appendix: The Ultimate Guide to TypeScript Error Messages, Causes, and Solutions
Customer Reviews