In retrospect, every single task or operation we do on top of our data is an iterative process that sends us on the path of understanding what needs we have in terms of data. While analyzing sales, let’s imagine that you find out that an organization, department, or region draws an imperfect picture, and numbers don’t match with official financial revenue systems. A storm is coming, and it is going to make the data ocean wild and turbulent… numbers won’t match.
We could start a drama here and show you the many meetings it took, the teams that collaborated, the back and forth, directors contacting directors, developers messaging developers, databases being queried, and hours and hours of investigation, but instead, let’s forward to months into the future. It is now known that the ERP system was patched with a customized interface that allows the sales department in Japan to do cross-department sales. Yes, there’s now new knowledge in the business process that throws light on the root cause, and a complex calculation has been implemented to allocate sales percentages to departments if a given department participated in a demo of a product for a different department.
The nightmare is finally over; tables called sales_ratio, sales, foreign_rate, and many more, are now part of the equation. You have to put all of them together in order to come up with an accurate calculation of sales. This is your job – create a full tracking of your data needs and gaps you have in order to make your analysis more complete. This is an iterative and sometimes recursive operation that you need to perform every day when trying to assess your data needs:
- You find your data, and you perform an analysis.
- You test and find out that something is missing.
- You find the stakeholders.
- You ask.
- You gather.
- You perform analysis.
- You test again.
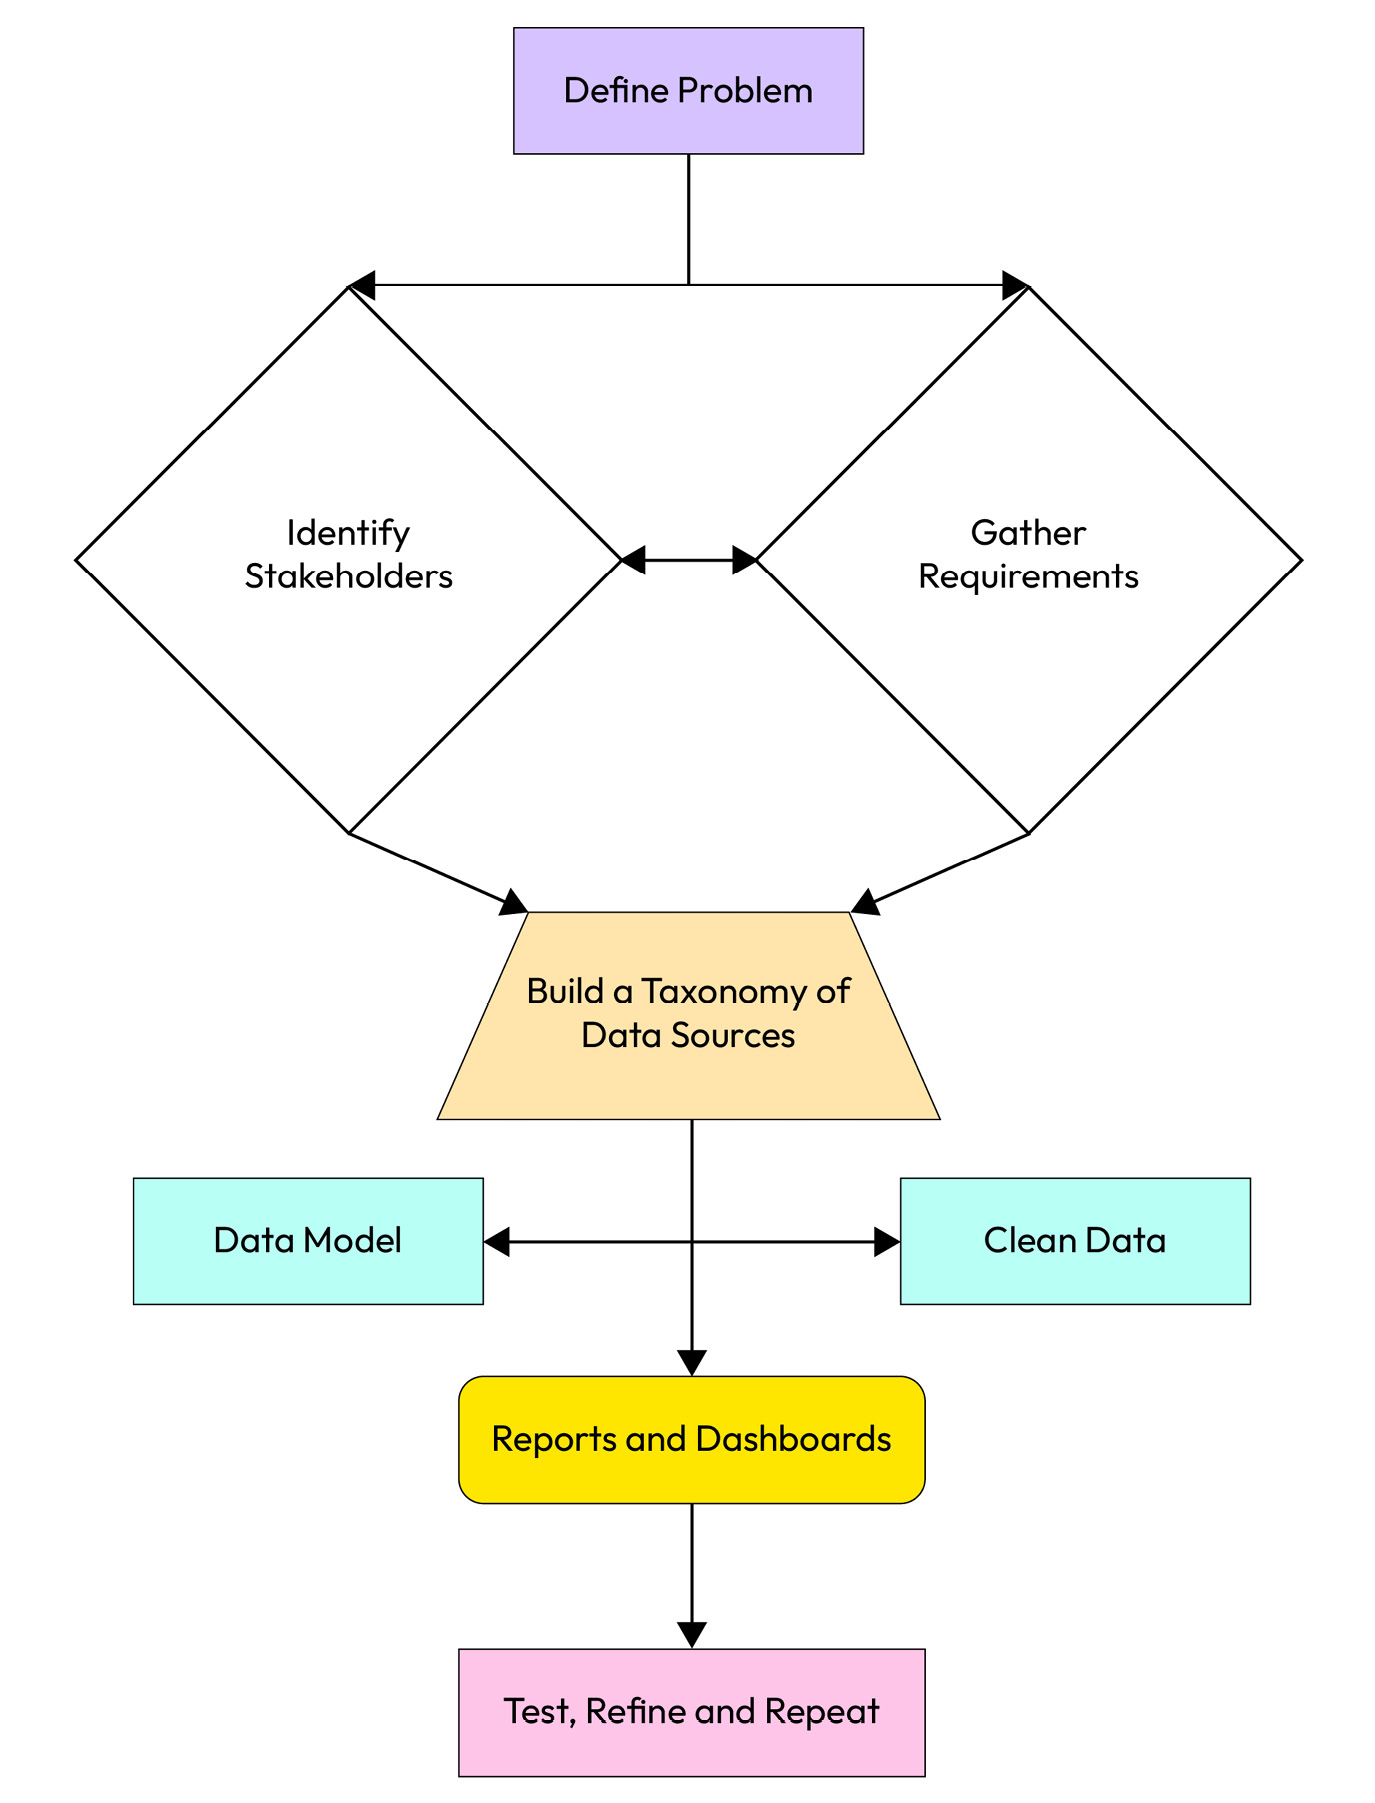
We can actually see these steps and organize them sequentially, resulting in better project management. If you visualize them, then you can plan better and specify deadlines that adjust according to the complexity of each step. Such a flow should be close to the following:
Figure 2.5 – A process flow to follow when trying to understand your customer’s data needs
Undoubtedly, it may seem challenging to emphasize this enough, but adhering to established guidelines is remarkably crucial when engaging in the inherently subjective and creative exercise of analyzing and exploring data. While this may appear contradictory, following a structured approach based on established principles adds objectivity to the process. By employing standardized methods and techniques, you can ensure a more consistent and unbiased analysis, allowing for meaningful insights to emerge from the data. Ultimately, by playing by the book, you foster a solid foundation for your data exploration endeavors, enabling a more rigorous and reliable interpretation of the information at hand:
- Define the business problem: Start by identifying the business problem or question that needs to be answered. This will help to determine what data is required and how it should be analyzed.
- Identify the stakeholders: Identify the stakeholders who will use the data and the insights generated from the analysis. This will help to understand their specific data needs and preferences.
- Conduct a requirements gathering: Conduct a requirement gathering process to collect information about the data needed for analysis. This process may involve interviews, surveys, focus groups, or other methods of gathering information from stakeholders. If this is difficult, create mock-ups, do not wait for your customers, find similar reports done by other analysts in the company or investigate common sales reports in the industry, study the domain, study sales if this is the subject of your investigation, and use common sense when creating basic reports. Go back to the stakeholders and go back and forth, iterating new improved versions of such mock-ups, in the hope that these spark some creativity in their minds. Any feedback will help you improve your prototypes. Prototyping is key; we’ll discuss more of this in Chapter 4.
If you don’t have any specific business requirements for a dashboard, you can still prototype a mock-up by following these steps:
- Define the purpose of the dashboard: Even without specific business requirements, you can define the general purpose of the dashboard. For example, is it intended to provide an overview of key metrics, or to allow users to drill down into specific data?
- Identify the target audience: Consider who the dashboard is intended for and what their needs might be. For example, do they need to see real-time data or historical trends? What level of detail is required?
- Choose the right visualization types: Select the visualization types that are best suited for the purpose and audience of the dashboard. For example, use pie charts to show proportions, bar charts to show comparisons, or maps to show geographic data.
- Create a wireframe: Use a tool such as Balsamiq or Sketch to create a wireframe of the dashboard. A wireframe is a basic mock-up that shows the layout and content of the dashboard without going into too much detail.
- Refine the design: Once you have a basic wireframe, you can start to refine the design by adding more detail, choosing colors and fonts, and adding real data where possible. You may also want to get feedback from stakeholders to help refine the design further.
By following these steps, you can prototype a mock-up dashboard even without specific business requirements. While the dashboard may not be fully optimized for the needs of the business, it can still provide a starting point for further development and refinement as requirements become clearer. The following are examples of actions you can take to refine and formalize data prototypes:
- Identify the data sources: Identify the data sources that contain the required data. This may include internal data sources such as databases or spreadsheets, as well as external data sources such as third-party data providers.
- Assess the quality of the data: Assess the quality of the data to ensure that it is accurate, complete, and relevant to the analysis. This may involve data cleansing, data validation, or other data quality assurance processes.
- Develop a data model: Develop a data model that defines the relationships between the different data elements. This will help to ensure that the data is organized in a way that is suitable for analysis.
- Create reports and dashboards: Create reports and dashboards that visualize data in a way that is easy to understand and analyze. This may involve creating charts, graphs, tables, or other visualizations.
- Test and refine the analysis: Test the analysis and refine it based on feedback from stakeholders. This may involve making changes to the data model, modifying the reports and dashboards, or adjusting the analysis approach. By following these steps, an analyst can understand the data needs of a business and develop a BI solution that meets those needs. This will help to ensure that the analysis is accurate, relevant, and actionable and that it provides insights that drive business performance.
This process is quite subjective, and depending on your company, the output could be different. By setting your expectations correctly and continuously improving your mapping of your data architecture, you will become proficient when trying to identify new data needs in your organization.


 Free Chapter