The initial and imperative step is to construct a comprehensive taxonomy of your data sources. Without any delay, dedicate yourself to gathering all the relevant data sources, and meticulously sketch out a well-structured diagram that depicts the interdependencies and relationships within the data flow, across the various repositories it encounters. By creating a clear visual representation of this data ecosystem, you will gain valuable insights into the origins, transformations, and destinations of your data, facilitating a more organized and systematic approach to data management.
Building a taxonomy of your data sources involves organizing your data into a hierarchical structure that reflects its relationships and dependencies:
- Identify the scope and purpose of your taxonomy: Determine the purpose of the taxonomy and what it will be used for. Decide on the level of detail and granularity you need for your taxonomy.
- Collect information about your data sources: Gather information about all your data sources, including databases, files, applications, and systems. Identify the attributes that describe each data source, such as type, format, subject matter, and frequency of updates.
- Categorize your data sources: Identify the categories and subcategories that your data sources belong to. Create a hierarchy that reflects the relationships between the categories and subcategories.
- Define the relationships between the categories: Determine how the categories and subcategories are related to each other. For example, a database of customer information might be related to a sales system and a marketing system.
- Create a classification scheme: Develop a set of rules and guidelines to classify data sources. This will ensure that new data sources can be easily categorized and added to the taxonomy.
- Test and refine the taxonomy: Test the taxonomy with a small sample of data sources to ensure that it reflects the flow as expected. Refine the taxonomy as needed to ensure that it accurately reflects the relationships between your data sources. Find leaks and adjust for possible branches that data hangs from.
Technically speaking, this translates into finding logs and monitoring data pipelines. However, this might be complicated, as you may not have access to these resources. In a worst-case scenario, your data sources consist of a simple file in your possession that some data engineer lands in your inbox, so what would we do next in this scenario?
- Ask where it comes from.
- Ask with what frequency it gets generated.
- Ask how long it takes to generate.
- Find out what other processes or data sources are involved in its creation.
- Find out whether the source is larger or smaller. Is it an aggregate?
- Start mapping and demanding information to map out and reach other levels in your taxonomy.
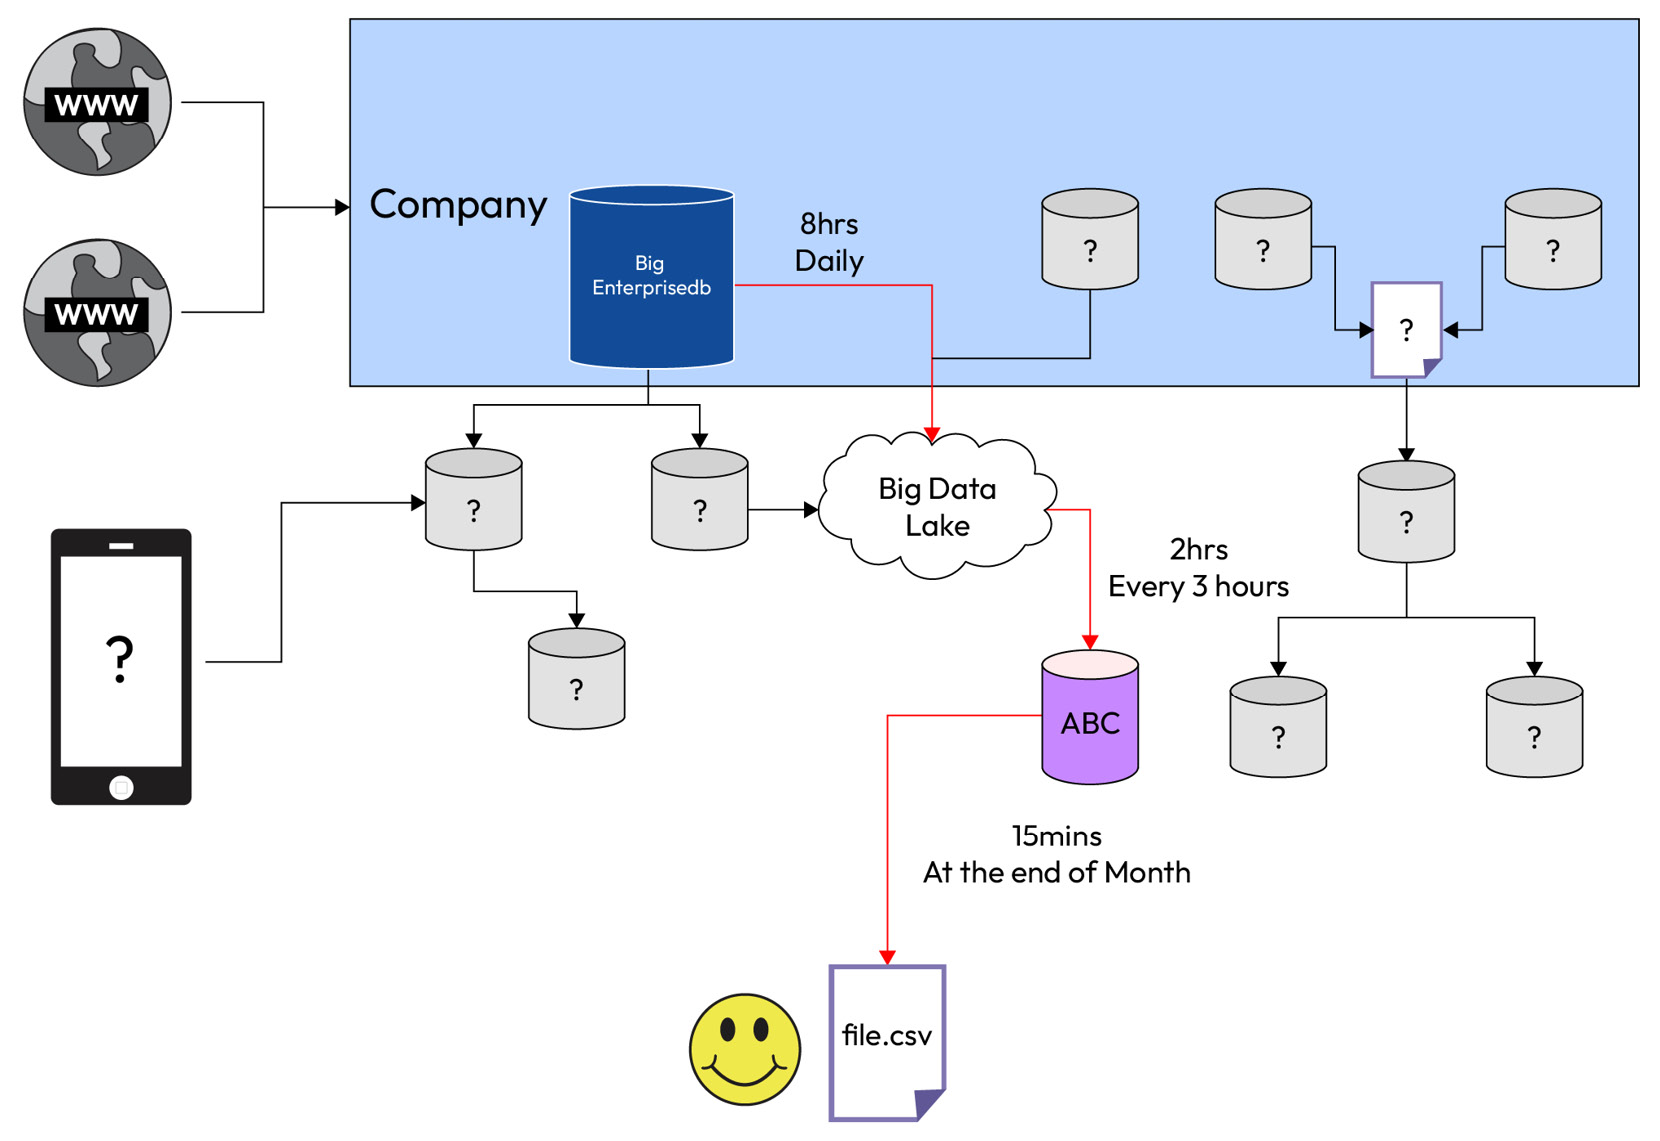
At the end of this exercise, you will have a sort of sequence that is missing lots of steps and levels, but it is like a candle; the more you navigate, the more you light up with your inquiries. The whole map of data sources often is a convoluted one and is designed to please specific situations, rather than a holistic solution that prioritizes data flow efficiency. There are many reasons why this happens, but that’s what makes this exercise even more important. It will encourage you to ask more questions. Having a whole image of the map in mind (as shown in the following figure) will help you find the paths where data flows, improving the gaps in your knowledge.
Figure 2.1 – A typical data infrastructure showing the unknown paths data takes
Gather all the facts at your disposal, and like a detective, put them in sequence. Once you hit a wall, like a rat in a maze, find your way around by asking the teams involved in those unknown systems. In the scenario portrayed in the preceding diagram, this is what we know so far as a new data analyst at Big Corp X:
- You now have a
data.csv file
- It comes from database ABC as an aggregate table called
agg_data
- This table pulls from a data lake called Big Data Lake
- This data lake also gets data from a transactional system called Big Enterprise System
Building a taxonomy of your data sources is important in a data project for several reasons, as listed here:
- Improved data management: A taxonomy can help you better organize and manage your data sources. It can help you identify data redundancies, data quality issues, and gaps in data coverage. By having a clear understanding of your data sources, you can make more informed decisions about how to collect, store, and analyze your data.
- Enhanced data analysis: With a taxonomy in place, you can more easily perform data analysis across multiple data sources. A taxonomy can help you identify relationships and dependencies between data sources and select the most appropriate data sources for your analysis.
- Facilitate collaboration: A taxonomy can help facilitate collaboration among team members. By having a standardized way of organizing and labeling data sources, team members can more easily share and communicate about data. This can lead to more efficient and effective data analysis and decision-making.
- Better decision-making: By having a taxonomy in place, you can more easily identify patterns and trends in your data and make more informed decisions based on this information. A taxonomy can help you identify which data sources are most relevant to a particular business question and can help you ensure that you use the most accurate and complete data available.
Building a taxonomy of your data sources is important in a data project because it can improve data management, enhance data analysis, facilitate collaboration, and lead to better decision-making. At the end of this exercise, you will have a clear idea of where to go and who to ask for any data-related questions. It is not about knowing everything in terms of data but, instead, knowing where you need to get information from in order to make your analysis better.
Here are the steps on how to build an effective data model of your data sources:
- Define your business needs: What are you trying to accomplish with your data model? What data do you need to collect and store? What questions do you need to answer?
- Identify your data sources: Where is your data coming from? What format is it in?
- Understand your data: What are the different types of data you have? What are the relationships between the data?
- Design your data model: Create a diagram that shows how your data is related.
- Implement your data model: Create the tables and columns in your database.
- Test your data model: Make sure that you can access and use your data.
- Maintain your data model: As your data changes, you need to update your data model accordingly.
Now that you have created a map and have an idea of where data is located at every step of the pipeline, it is time for you to explore it. Doing it manually would be a waste of energy when we have modern BI tools that excel beyond our capabilities. The question here is not only how to pick the best one but also a more general one – what features you should use in order to allow you a thorough exploration of the data.


 Free Chapter