Let's begin by importing the necessary libraries and preparing the dataset:
- Import the required Python libraries and the dataset:
import pandas as pd
import numpy as np
import matplotlib.pyplot as plt
import seaborn as sns
from sklearn.datasets import load_boston
- Load the Boston House Prices dataset from scikit-learn and retain three of its variables in a dataframe:
boston_dataset = load_boston()
boston = pd.DataFrame(boston_dataset.data, columns=boston_dataset.feature_names)[['RM', 'LSTAT', 'CRIM']]
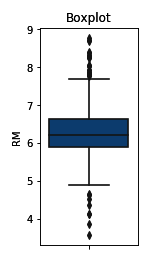
- Make a boxplot for the RM variable:
sns.boxplot(y=boston['RM'])
plt.title('Boxplot')
The output of the preceding code is as follows:
We can change the final size of the plot using the figure() method from Matplotlib. We need to call this command before making the plot with seaborn:
plt.figure(figsize=(3,6))
sns.boxplot(y=boston['RM'])
plt.title('Boxplot')
To find the outliers in a variable, we need to find the distribution boundaries according to the IQR proximity rule, which we discussed in the Getting ready section of this recipe.
- Create a function that takes a dataframe, a variable name, and the factor to use in the IQR calculation and returns the IQR proximity rule boundaries:
def find_boundaries(df, variable, distance):

    IQR = df[variable].quantile(0.75) - df[variable].quantile(0.25)

    lower_boundary = df[variable].quantile(0.25) - (IQR * distance)
    upper_boundary = df[variable].quantile(0.75) + (IQR * distance)

    return upper_boundary, lower_boundary
- Calculate and then display the IQR proximity rule boundaries for the RM variable:
upper_boundary, lower_boundary = find_boundaries(boston, 'RM', 1.5)
upper_boundary, lower_boundary
The find_boundaries() function returns the values above and below which we can consider a value to be an outlier, as shown here:
(7.730499999999999, 4.778500000000001)
If you want to find very extreme values, you can use 3 as the distance of find_boundaries() instead of 1.5.
Now, we need to find the outliers in the dataframe.
- Create a boolean vector to flag observations outside the boundaries we determined in step 5:
outliers = np.where(boston['RM'] > upper_boundary, True,
            np.where(boston['RM'] < lower_boundary, True, False))
- Create a new dataframe with the outlier values and then display the top five rows:
outliers_df = boston.loc[outliers, 'RM']
outliers_df.head()
We can see the top five outliers in the RM variable in the following output:
97     8.069
98     7.820
162    7.802
163    8.375
166    7.929
Name: RM, dtype: float64
To remove the outliers from the dataset, execute boston.loc[~outliers, 'RM'].