


In the previous examples, we saw the F-value for the performance of the whole model. Now, let's look at the F-distribution. Assume that x1 and x2 are two independent random variables with the Chi-Square distribution with df1 and df2 degrees of freedom, respectively. The ratio of x1/df1 divided by x2/df2 would follow an F-distribution:

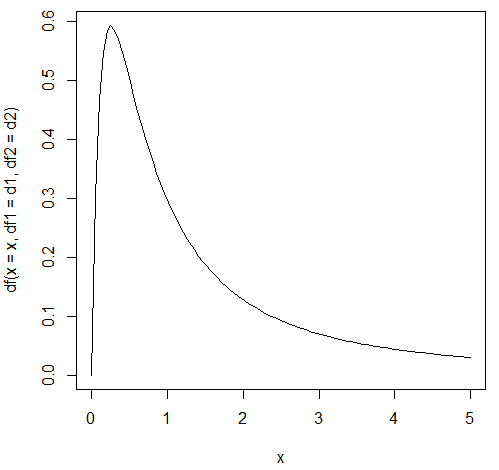
An R program to draw a graph for the F distribution with (10, 2) degrees of freedom is shown here:
> d1<-4
> d2<-2
> n<-100
> x = seq(0, 5, length = n)
> plot(x, df(x = x, df1 = d1, df2 = d2),type='l')
The related plot is shown here:
The following R program shows the critical value for a given α of 0.1 and (1, 2) degrees of freedom:
> alpha<-0.1
> d1<-1
> d2<-1
> qf(1-alpha,df1=d1,df2=d2)
[1] 39.86346
The following Python program...


