Sign In Start Free Trial
Account

Add to playlist

Create a Playlist

Modal Close icon
You need to login to use this feature.
  • Learning SAP Analytics Cloud
  • Toc
  • feedback
Learning SAP Analytics Cloud

Learning SAP Analytics Cloud

By : Ahmed
3.2 (5)
close
Learning SAP Analytics Cloud

Learning SAP Analytics Cloud

3.2 (5)
By: Ahmed

Overview of this book

The book starts with the basics of SAP Analytics Cloud (formerly known as SAP BusinessObjects Cloud) and exposes almost every significant feature a beginner needs to master. Packed with illustrations and short, essential, to-the-point descriptions, the book provides a unique learning experience. Your journey of exploration starts with a basic introduction to the SAP Analytics Cloud platform. You will then learn about different segments of the product, such as Models, Stories, Digital Boardroom, and so on. Then, you are introduced to the product's interface: the Home screen, the main menu, and more. Then comes the hands-on aspect of the book, which starts with model creation. Next, you learn how to utilize a model to prepare different types of stories(reports) with the help of charts, tables, Geo Maps, and more. In the final chapters of this book, you will learn about Digital Boardroom, Collaboration, and Administration.
Table of Contents (11 chapters)
close

Anatomy of SAP Analytics Cloud

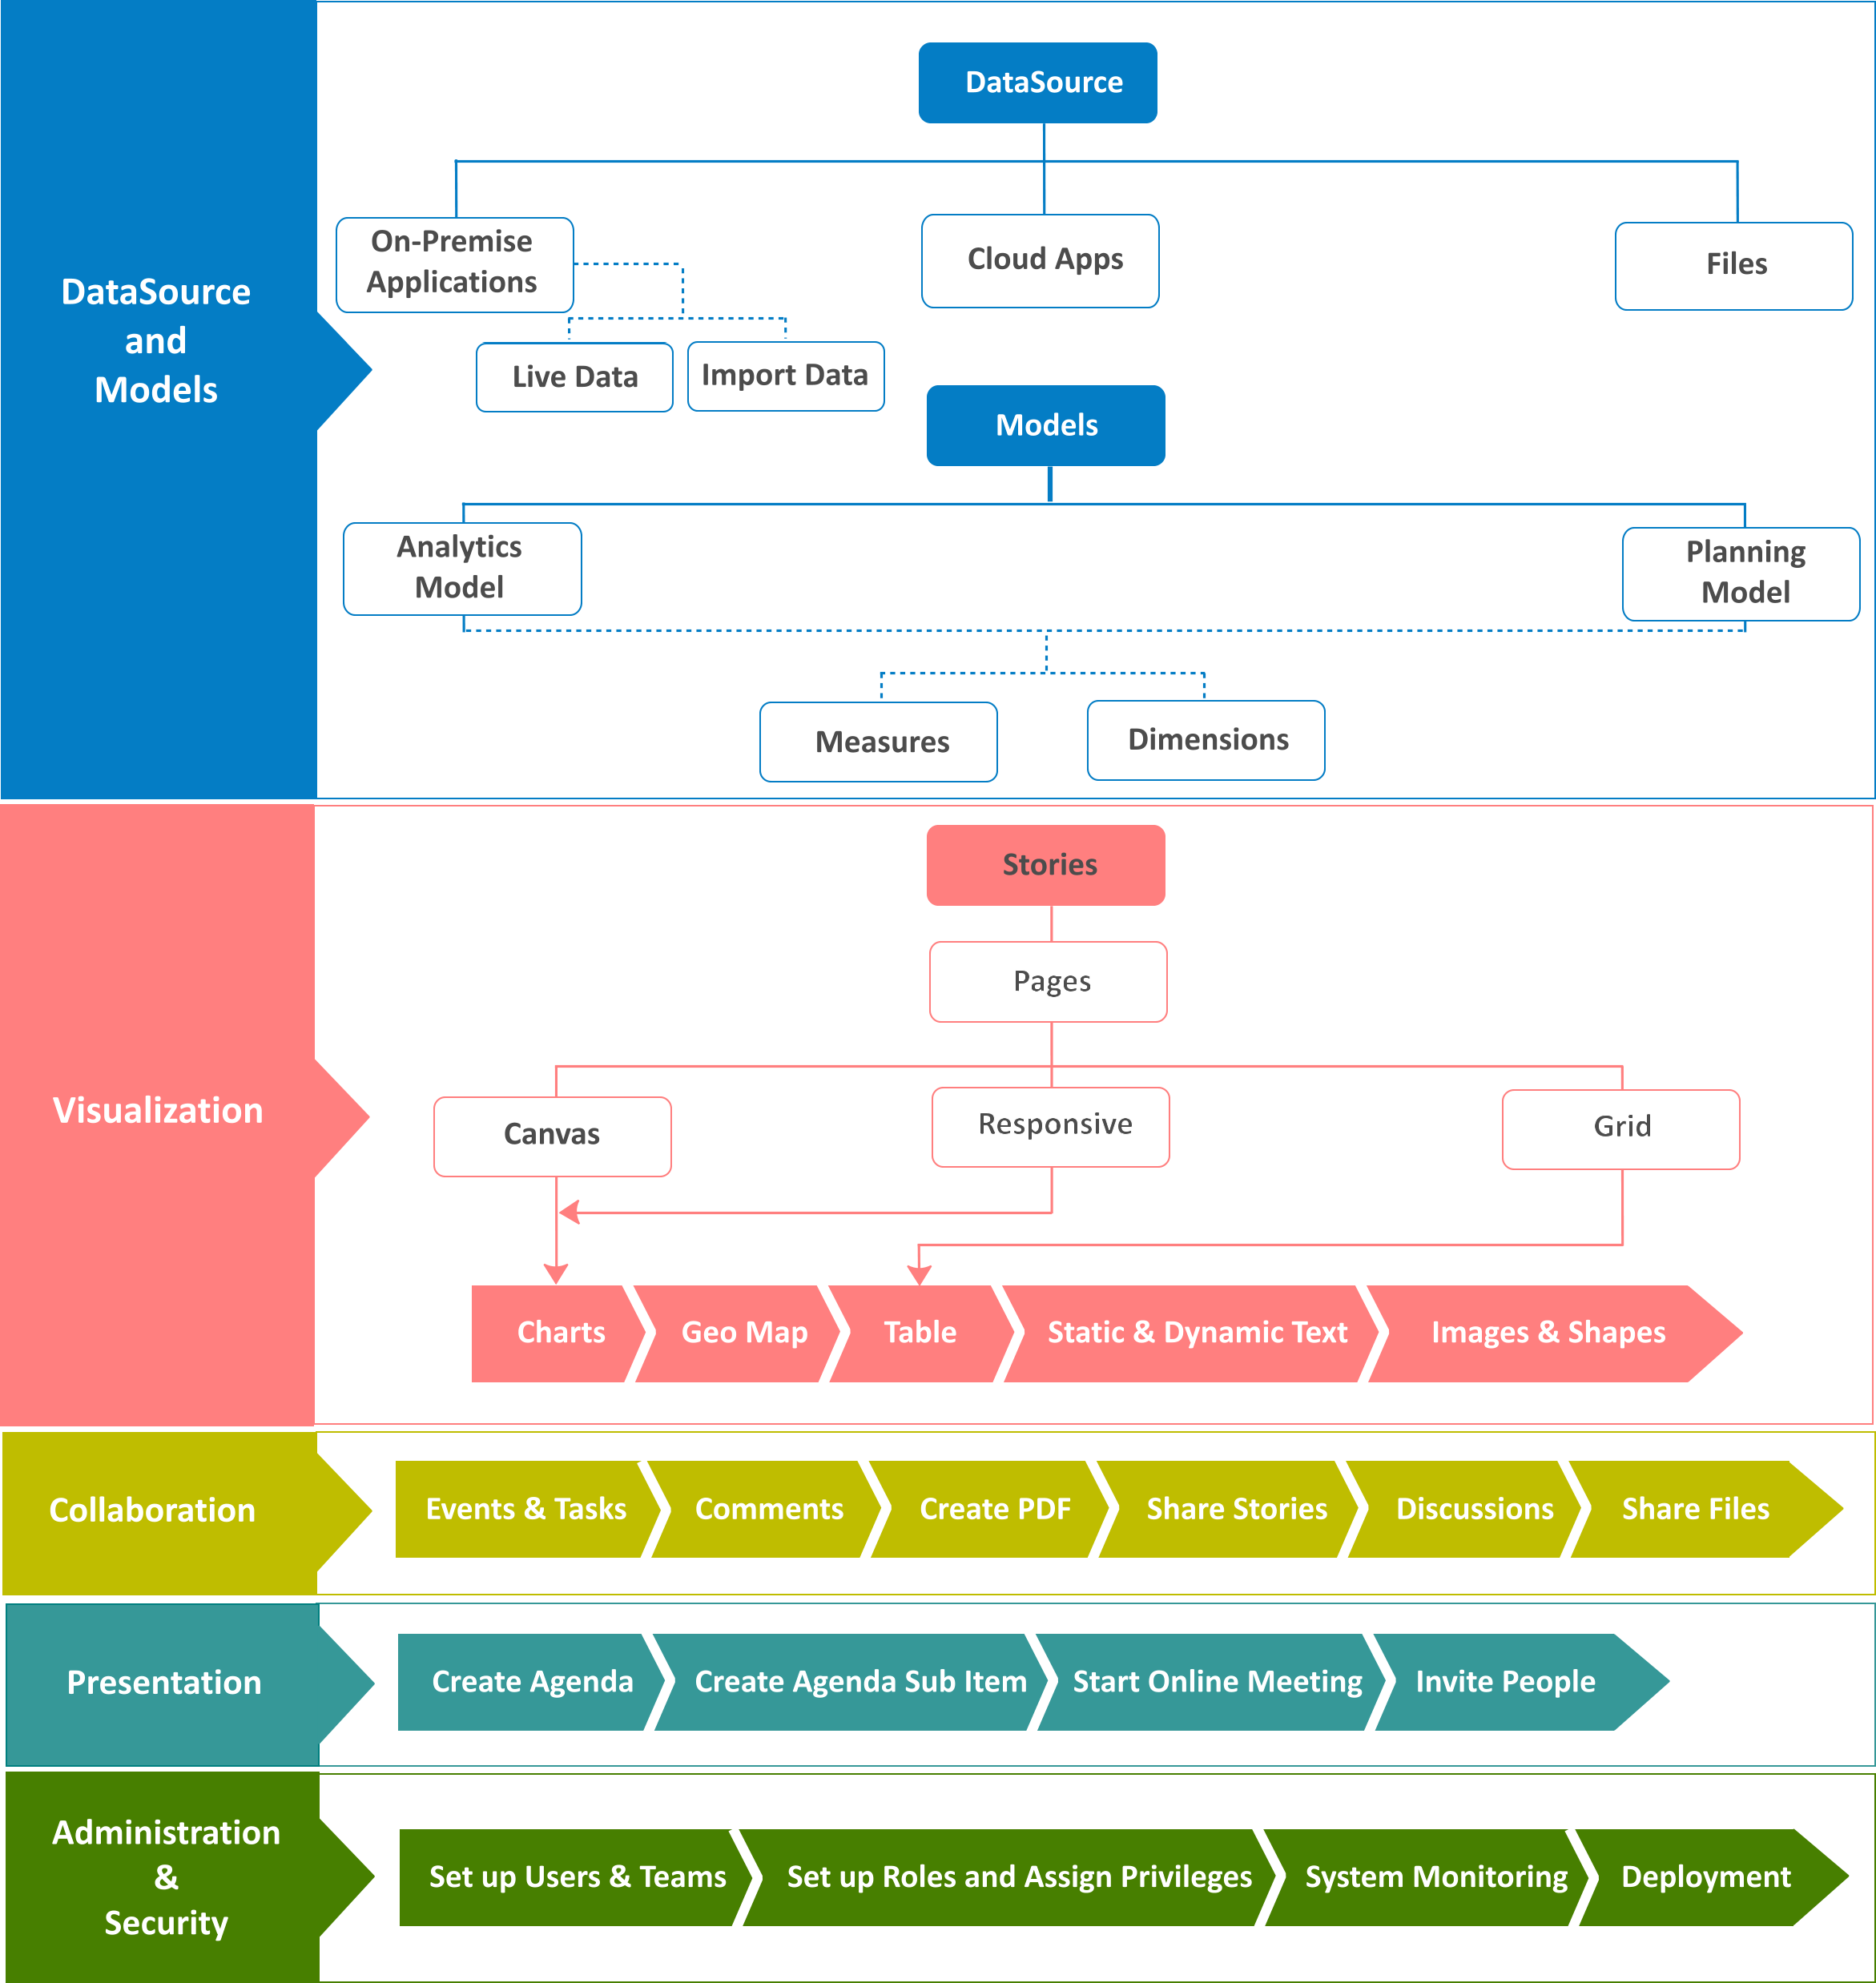
Models are the basis for all of your analysis in SAP Analytics Cloud. You can create planning and analytics models based on the cloud or on-premise data sources. Besides creating a simple analytics model, business analysts and finance professionals can quickly and easily build connected planning models to analyze data and then collaborate with each other to attain better business performance. After creating these models, you can share it with other users in your organization. Before sharing, you can set up model access privileges for users according to their level of authorization and can also enable data auditing. With the help of SAP Analytics Cloud's analytical capabilities, users can discover hidden traits in the data and can predict likely outcomes. It equips them with the ability to uncover potential risks and hidden opportunities.

Once you have created a model and set up appropriate security for it, you can create stories in which the underlying model data can be explored and visualized with the help of different types of charts, geo maps, and tables. There is a wide range of charts you can add to your story pages to address different scenarios. The intelligent charting feature of SAP Analytics Cloud proposes the ideal chart type based on data relationships. On your story pages, you can link dimensions to present data from multiple sources. Adding reference lines and thresholds, applying filters, and drilling down into data can be done on the fly. The ability to interactively drag and drop page objects is the most useful feature of this application.

The collaboration, alert, and notification features of SAP Analytics Cloud keep business users in touch with each other while executing their tasks.

In the past, board meetings were held in which the participants used to deliver their reports through their laptops and a bunch of papers. With different versions of reality, it was very difficult for decision makers to arrive at a good decision. With the advent of the SAP digital boardroom, board meetings have been revolutionized. It is a next-generation presentation platform, which helps you visualize your data and plan ahead in a real-time environment. It runs on multiple screens simultaneously, displaying information from different sources. Due to this capability, more people can work together using a single dataset that consequently creates one version of reality to make the best decision.

With the help of the administration and security features of the application, you can create users and set up teams, create new roles with different system access privileges and assign them to users, monitor the application usage, and use export and import utilities to deploy application content.

The following figure depicts the anatomy of SAP Analytics Cloud:

The Home screen

When you successfully log in to SAP Analytics Cloud, you are greeted with the Home screen. Note that the Home screen is private to every SAP Analytics Cloud user, so it can't be shared. Here are a few pointers to help you get acclimatized to the Home screen:

  1. To remove the Get Started widget, the Recent Stories tile, or the Welcome message, go to the Home menu, and deselect the item you want to remove.
  2. The Home screen also allows you to add useful reminders for upcoming events and personal notes.
  3. Using the Edit Background option, you can customize the display background and add a logo to the Home screen.
  4. The first tile titled Recent Stories lists the five most recent stories you have accessed.
  5. Your recent stories and visualizations are displayed as tiles. You can pin additional tiles from your stories to the Home screen.
  6. Click the ellipsis icon to modify or delete a note.
  7. The toolbar appears on top of every screen. Using the icons on the toolbar, users can see their own profiles, view notifications, get online help, view the time panel, and collaborate.

The main menu

The following screenshot and bullets will help you understand the main menu better:

  1. The main menu icon is your gateway to SAP Analytics Cloud. It provides you with all the options to get things done.
  2. Click on Create to add new Stories, Models, Process, Dimension, Currency, and Point of Interest. Models are discussed in Chapter 2, Models in SAP Analytics Cloud, and Chapter 3, Planning Model, whereas you will create stories in Chapters 4 to 7. The Allocation option under the Process sub-menu is discussed in Chapter 3, Planning Model.
  3. Select Browse to access existing Stories, Models, Dimensions, Currencies, Point of Interest, and Files. Files are discussed in Chapter 8, Collaboration.
  4. The Events option opens the Events page, where you can manage your planning and analytic activities and assign tasks to other users. This subject is discussed in Chapter 8, Collaboration.
  5. The options provided in the Security menu items lets you create and manage application users, teams, roles, requests, and monitor data changes and user activities. These options are discussed in Chapter 10, System Administration.
  6. Deployment includes creation and management of export and import of application content. This subject is discussed in Chapter 10, System Administration.
  1. Using the Connections menu item, you can create and maintain connections to remote systems. You can create connections to import data into SAP Analytics Cloud or create live data connections to SAP HANA. You will see some instances of establishing connections later in this chapter.
  2. The System menu item includes the Monitor, Administration, and Enabling SAML Single Sign-On (SSO) options. Using these options, the system administrator monitors the system, reads system events and errors in the system log, and sets up SAML Single Sign-On (SSO) to work with SAP Analytics Cloud.
Due to the frequent updates SAP makes to the application, the screenshots provided in this book might differ from yours.
bookmark search playlist download font-size

Change the font size

margin-width

Change margin width

day-mode

Change background colour

Close icon Search
Country selected

Close icon Your notes and bookmarks

Delete Bookmark

Modal Close icon
Are you sure you want to delete it?
Cancel
Yes, Delete