-
Book Overview & Buying

-
Table Of Contents

-
Feedback & Rating

Mastering Data Visualization with Microsoft Visio Professional 2016
By :
Mastering Data Visualization with Microsoft Visio Professional 2016
By:
Overview of this book
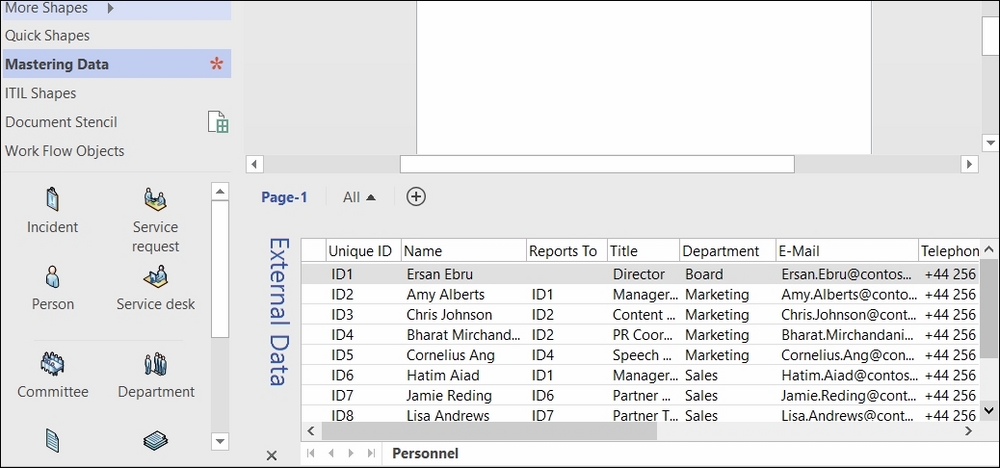
Microsoft Visio Professional is a data visualization application that is used by many different market sectors and many different departments to represent information visually, from network infrastructure to organization charts, from process diagrams to office layouts.
Starting off with a brief introduction to Visio Professional 2016 and then moving on to data storage, linking data to shapes, and working with SQL Server to create a solid foundation. Then we’ll cover topics such as refreshing data, working with geographical data, working with various graphics, and diagrams, and more. Finally, you’ll find out how to deploy custom stencils, templates, and code.
Table of Contents (13 chapters)
Preface

 Free Chapter
1. Data within Visio Essentials
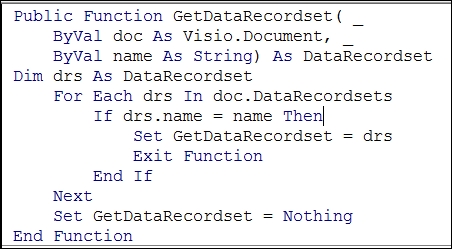
2. Understanding How Data Is Stored within Visio
3. Linking Data to Shapes
4. Using the Built-In Data Graphics
5. Using the Pivot Diagram Add-On
6. Creating Custom Master Shapes
7. Creating Custom Data Graphics
8. Validating and Extracting Information
9. Automating Structured Diagrams
10. Sharing Data Diagrams
11. Choosing a Deployment Methodology
Index
Customer Reviews