-
Book Overview & Buying
-
Table Of Contents

-
Feedback & Rating

Essential Statistics for Non-STEM Data Analysts
By :
Essential Statistics for Non-STEM Data Analysts
By:
Overview of this book
Statistics remain the backbone of modern analysis tasks, helping you to interpret the results produced by data science pipelines. This book is a detailed guide covering the math and various statistical methods required for undertaking data science tasks.
The book starts by showing you how to preprocess data and inspect distributions and correlations from a statistical perspective. You’ll then get to grips with the fundamentals of statistical analysis and apply its concepts to real-world datasets. As you advance, you’ll find out how statistical concepts emerge from different stages of data science pipelines, understand the summary of datasets in the language of statistics, and use it to build a solid foundation for robust data products such as explanatory models and predictive models. Once you’ve uncovered the working mechanism of data science algorithms, you’ll cover essential concepts for efficient data collection, cleaning, mining, visualization, and analysis. Finally, you’ll implement statistical methods in key machine learning tasks such as classification, regression, tree-based methods, and ensemble learning.
By the end of this Essential Statistics for Non-STEM Data Analysts book, you’ll have learned how to build and present a self-contained, statistics-backed data product to meet your business goals.
Table of Contents (19 chapters)
Preface

Section 1: Getting Started with Statistics for Data Science
 Free Chapter
Chapter 1: Fundamentals of Data Collection, Cleaning, and Preprocessing
Chapter 2: Essential Statistics for Data Assessment
Chapter 3: Visualization with Statistical Graphs
Section 2: Essentials of Statistical Analysis
Chapter 4: Sampling and Inferential Statistics
Chapter 5: Common Probability Distributions
Chapter 6: Parametric Estimation
Chapter 7: Statistical Hypothesis Testing
Section 3: Statistics for Machine Learning
Chapter 8: Statistics for Regression
Chapter 9: Statistics for Classification
Chapter 10: Statistics for Tree-Based Methods
Chapter 11: Statistics for Ensemble Methods
Section 4: Appendix
Chapter 12: A Collection of Best Practices
Chapter 13: Exercises and Projects
Other Books You May Enjoy
Customer Reviews
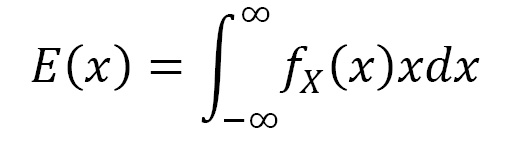
 the mean is calculated as follows: