-
Book Overview & Buying
-
Table Of Contents

-
Feedback & Rating

Implementing Microsoft Azure Architect Technologies: AZ-303 Exam Prep and Beyond
By :
Implementing Microsoft Azure Architect Technologies: AZ-303 Exam Prep and Beyond
By:
Overview of this book
From designing solutions on Azure to configuring and managing virtual networks, the AZ-303 certification validates your knowledge and skills for all this and much more. Whether you want to take the certification exam or gain hands-on experience in administering, developing, and architecting Azure solutions, this study guide will help you get started.
Divided into four modules, this book systematically takes you through the wide range of concepts and features covered in the AZ-303 exam. The first module demonstrates how to implement and monitor infrastructure. You'll develop the skills required to deploy and manage core Azure components such as virtual machines, networking, storage, and Active Directory (AD). As you progress, you'll build on that knowledge and learn how to create resilient and secure applications before moving on to working with web apps, functions, and containers. The final module will get you up to speed with data platforms such as SQL and Cosmos DB, including how to configure the different high availability options. Finally, you'll solve mock tests and assess yourself with the answers provided to get ready to take the exam with confidence.
By the end of this book, you'll have learned the concepts and techniques you need to know to prepare for the AZ-303 exam and design effective solutions on Microsoft Azure.
Table of Contents (25 chapters)
Preface

Section 1: Implement and Monitor Azure Infrastructure
 Free Chapter
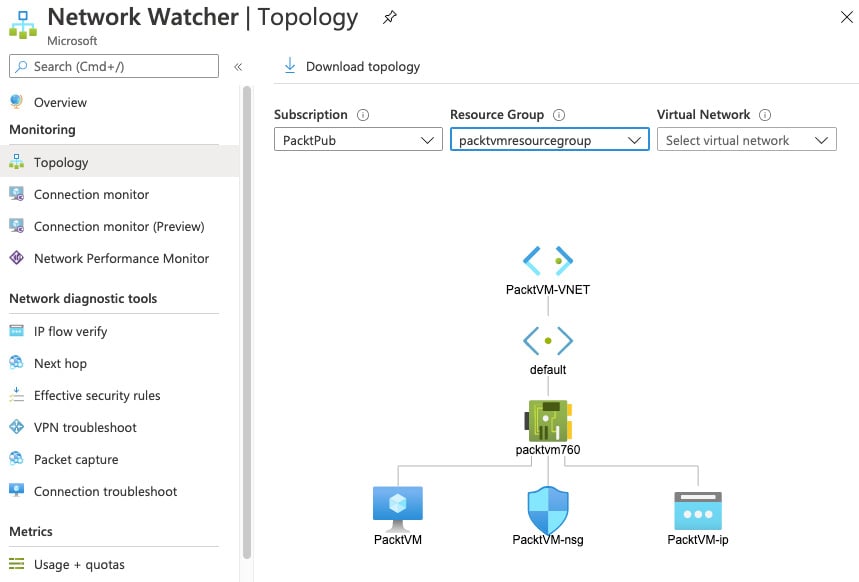
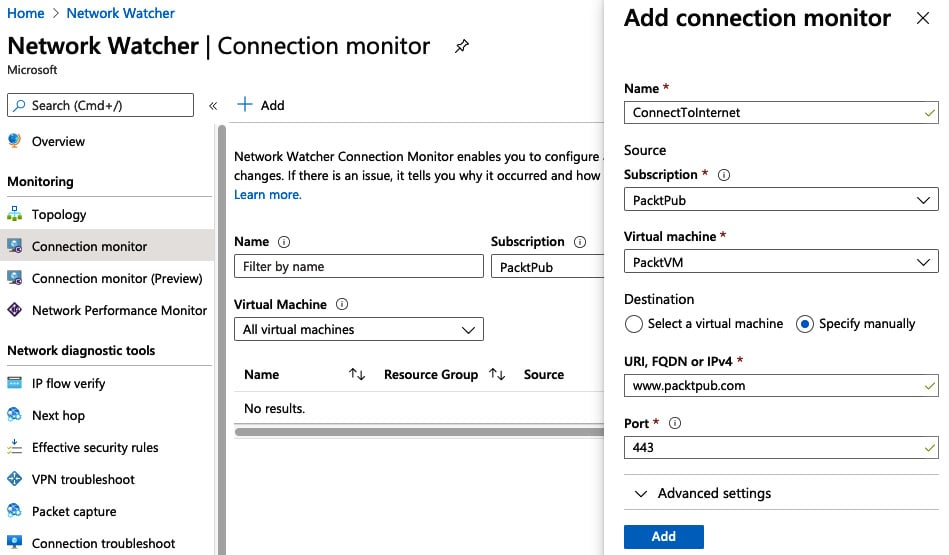
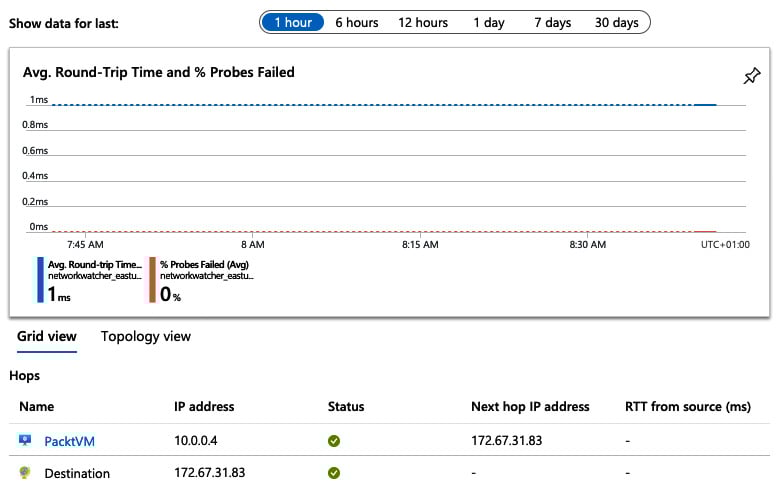
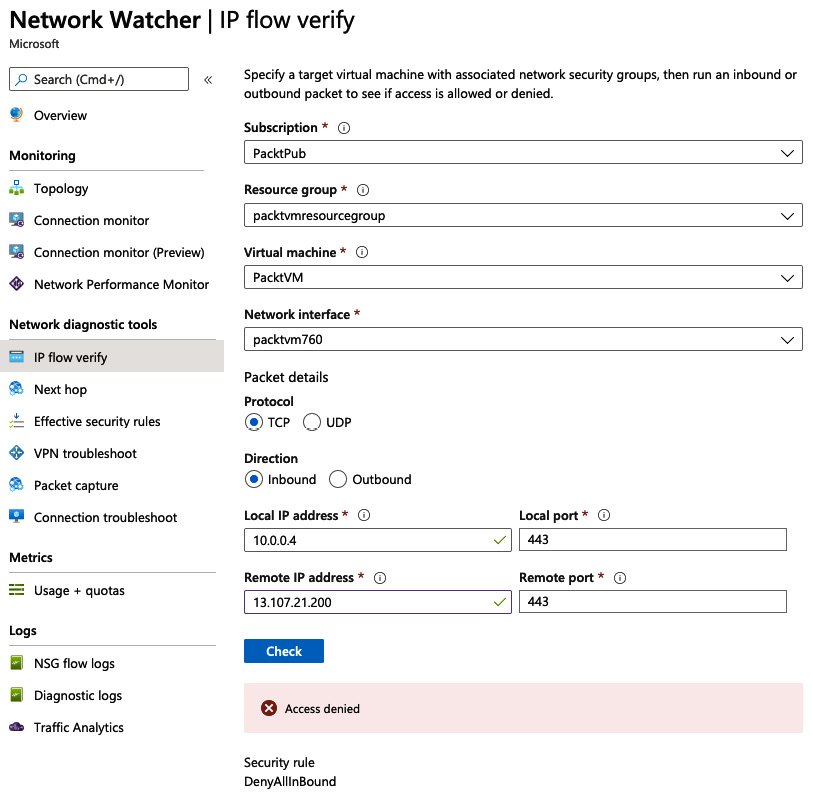
Chapter 1: Implementing Cloud Infrastructure Monitoring
Chapter 2: Creating and Configuring Storage Accounts
Chapter 3: Implementing and Managing Virtual Machines
Chapter 4: Implementing and Managing Virtual Networking
Chapter 5: Creating Connectivity between Virtual Networks
Chapter 6: Managing Azure Active Directory (Azure AD)
Chapter 7: Implementing Multi-Factor Authentication (MFA)
Chapter 8: Implementing and Managing Hybrid Identities
Section 2: Implement Management and Security Solutions
Chapter 9: Managing Workloads in Azure
Chapter 10: Implementing Load Balancing and Networking Security
Chapter 11: Implementing Azure Governance Solutions
Section 3: Implement Solutions for Apps
Chapter 12: Creating Web Apps Using PaaS and Serverless
Chapter 13: Designing and Developing Apps for Containers
Chapter 14: Implementing Authentication
Section 4: Implement and Manage Data Platforms
Chapter 15: Developing Solutions that Use Cosmos DB Storage
Chapter 16: Developing Solutions that Use a Relational Database
Chapter 17: Mock Exam Questions
Chapter 18: Mock Exam Answers
Assessments
Other Books You May Enjoy
Customer Reviews