Sign In Start Free Trial
Account

Add to playlist

Create a Playlist

Modal Close icon
You need to login to use this feature.
  • Hands-On Geospatial Analysis with R and QGIS
  • Toc
  • feedback
Hands-On Geospatial Analysis with R and QGIS

Hands-On Geospatial Analysis with R and QGIS

By : Hamson, Islam
3.3 (3)
close
Hands-On Geospatial Analysis with R and QGIS

Hands-On Geospatial Analysis with R and QGIS

3.3 (3)
By: Hamson, Islam

Overview of this book

Managing spatial data has always been challenging and it's getting more complex as the size of data increases. Spatial data is actually big data and you need different tools and techniques to work your way around to model and create different workflows. R and QGIS have powerful features that can make this job easier. This book is your companion for applying machine learning algorithms on GIS and remote sensing data. You’ll start by gaining an understanding of the nature of spatial data and installing R and QGIS. Then, you’ll learn how to use different R packages to import, export, and visualize data, before doing the same in QGIS. Screenshots are included to ease your understanding. Moving on, you’ll learn about different aspects of managing and analyzing spatial data, before diving into advanced topics. You’ll create powerful data visualizations using ggplot2, ggmap, raster, and other packages of R. You’ll learn how to use QGIS 3.2.2 to visualize and manage (create, edit, and format) spatial data. Different types of spatial analysis are also covered using R. Finally, you’ll work with landslide data from Bangladesh to create a landslide susceptibility map using different machine learning algorithms. By reading this book, you’ll transition from being a beginner to an intermediate user of GIS and remote sensing data in no time.
Table of Contents (12 chapters)
close
8
GRASS, Graphical Modelers, and Web Mapping

Vector data in QGIS

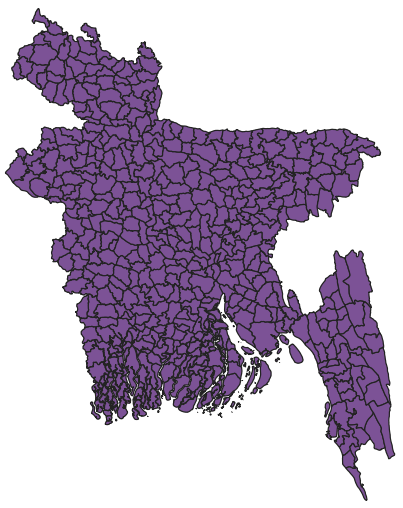
Now, we will work with a shapefile in QGIS and find out its projection system. First, we import a shapefile named BGD_adm4.shp from the folder Data under Chapter 2. To recall how to import a vector file, refer back to Chapter 1, Setting Up R and QGIS Environments for Geospatial Tasks.

Now, we will see the shapefile as follows:

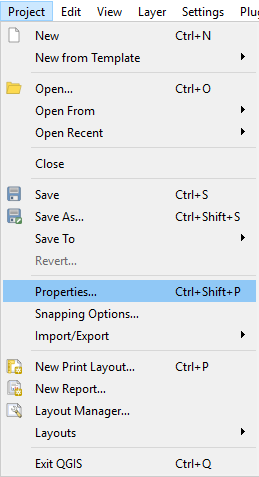
Now, to check out the projection system it is using, we need to click on Project Properties under Project in the menu bar as instructed in the following screenshot:

  1. Click on Project and then Properties... under it:
  1. Now, click on CRS:

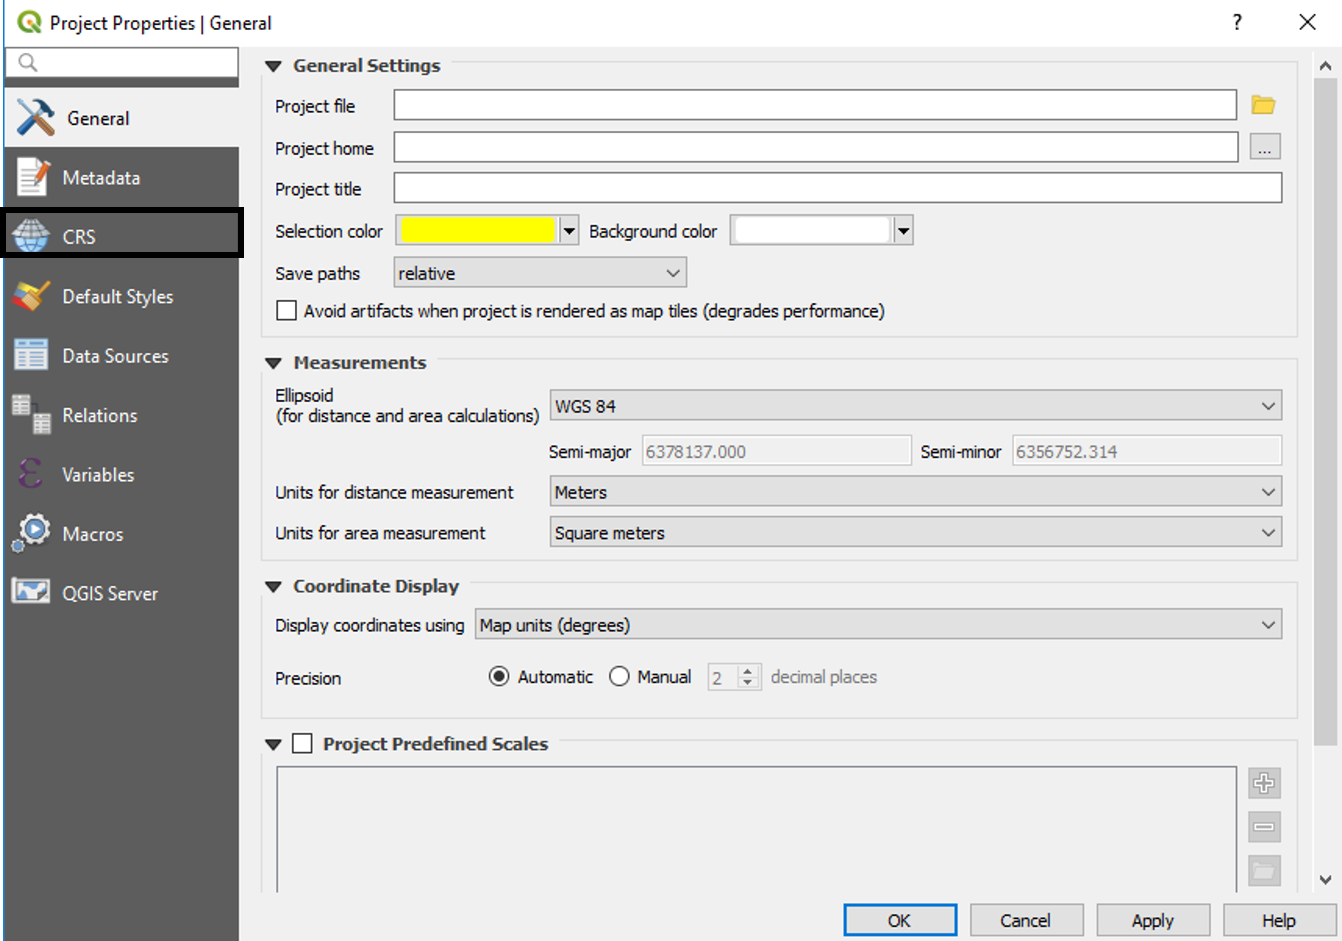
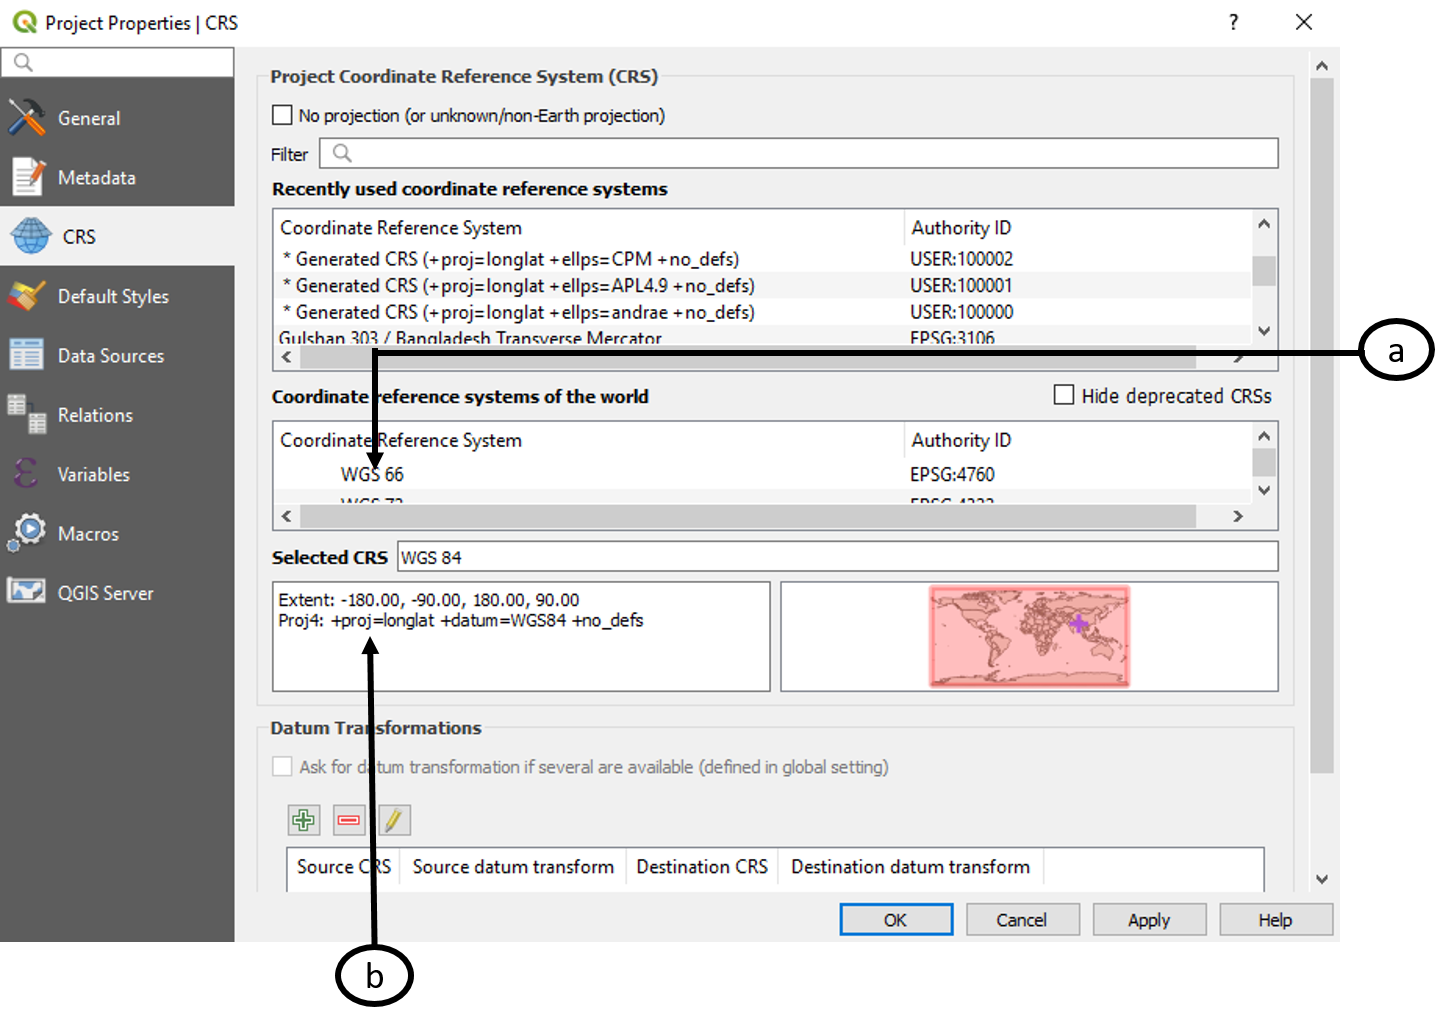
Now, we can see the coordinate system (a) and the spatial extent and projection (b) as shown in this screenshot:

We can also select and change CRS from the Layer panel. We can do so using the following steps:

  1. Right-click on the BGD_adm4 layer in the Layer panel. Click on Properties as highlighted...
bookmark search playlist download font-size

Change the font size

margin-width

Change margin width

day-mode

Change background colour

Close icon Search
Country selected

Close icon Your notes and bookmarks

Delete Bookmark

Modal Close icon
Are you sure you want to delete it?
Cancel
Yes, Delete