Sign In Start Free Trial
Account

Add to playlist

Create a Playlist

Modal Close icon
You need to login to use this feature.
  • Book Overview & Buying Tableau Desktop Certified Associate: Exam Guide
  • Table Of Contents Toc
  • Feedback & Rating feedback
Tableau Desktop Certified Associate: Exam Guide

Tableau Desktop Certified Associate: Exam Guide

By : Dmitry Anoshin, JC Gillet , Peri, Biyani, Makarenko
3.7 (7)
close
close
Tableau Desktop Certified Associate: Exam Guide

Tableau Desktop Certified Associate: Exam Guide

3.7 (7)
By: Dmitry Anoshin, JC Gillet , Peri, Biyani, Makarenko

Overview of this book

The Tableau Desktop Certified Associate exam measures your knowledge of Tableau Desktop and your ability to work with data and data visualization techniques. This book will help you to become well-versed in Tableau software and use its business intelligence (BI) features to solve BI and analytics challenges. With the help of this book, you'll explore the authors' success stories and their experience with Tableau. You'll start by understanding the importance of Tableau certification and the different certification exams, along with covering the exam format, Tableau basics, and best practices for preparing data for analysis and visualization. The book builds on your knowledge of advanced Tableau topics such as table calculations for solving problems. You'll learn to effectively visualize geographic data using vector maps. Later, you'll discover the analytics capabilities of Tableau by learning how to use features such as forecasting. Finally, you'll understand how to build and customize dashboards, while ensuring they convey information effectively. Every chapter has examples and tests to reinforce your learning, along with mock tests in the last section. By the end of this book, you'll be able to efficiently prepare for the certification exam with the help of mock tests, detailed explanations, and expert advice from the authors.
Table of Contents (15 chapters)
close
close
Free Chapter
1
Section 1: Getting Started with Tableau
3
Section 2: Answering Questions with Data
8
Section 3: Advanced Tableau
13
Mock Test A + B (Assessment)

Building grand totals and subtotals

Beyond showing the values from calculations, sometimes, we also want to show the values of the totals or subtotals in the same window as these values.

For instance, we have the following graph for SUM(Sales) split by Category and Sub-Category across segments:

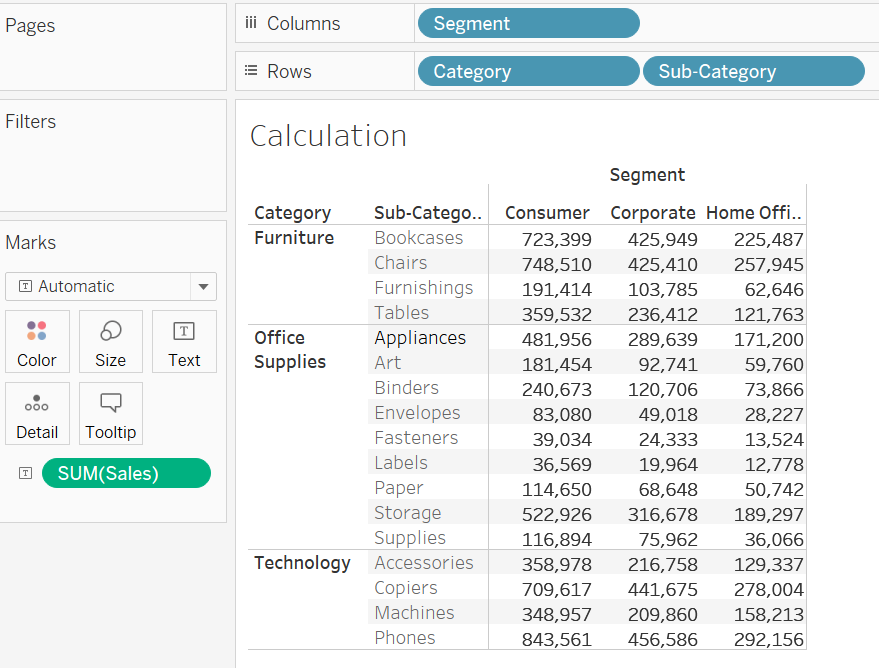
Now, if we want to add the subtotals and the grand totals for both rows and columns, we can do the following:

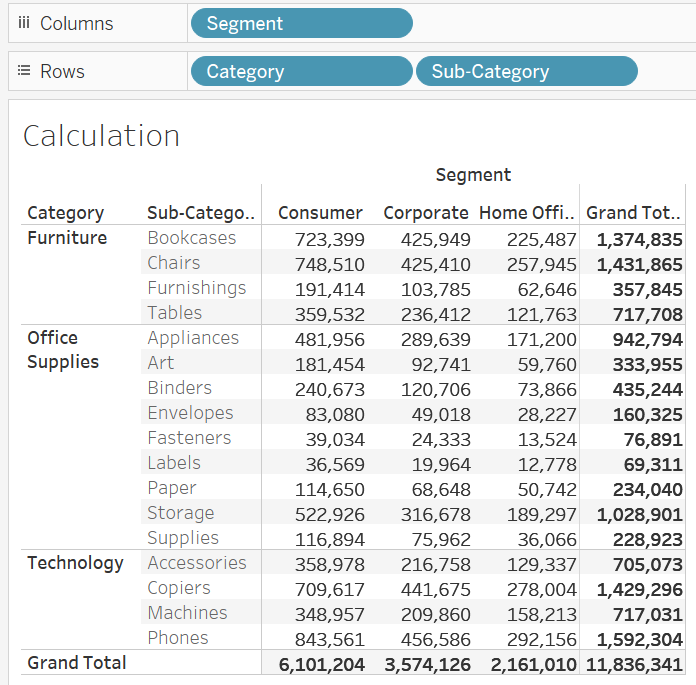
  1. Go to Analysis > Totals.
  2. Select Show Row Totals | Show Column Totals. This will show the graph as follows:
  1. Now if we want to see the subtotals too, we can select Add All Subtotals from Analysis | Tools. This will show the following:

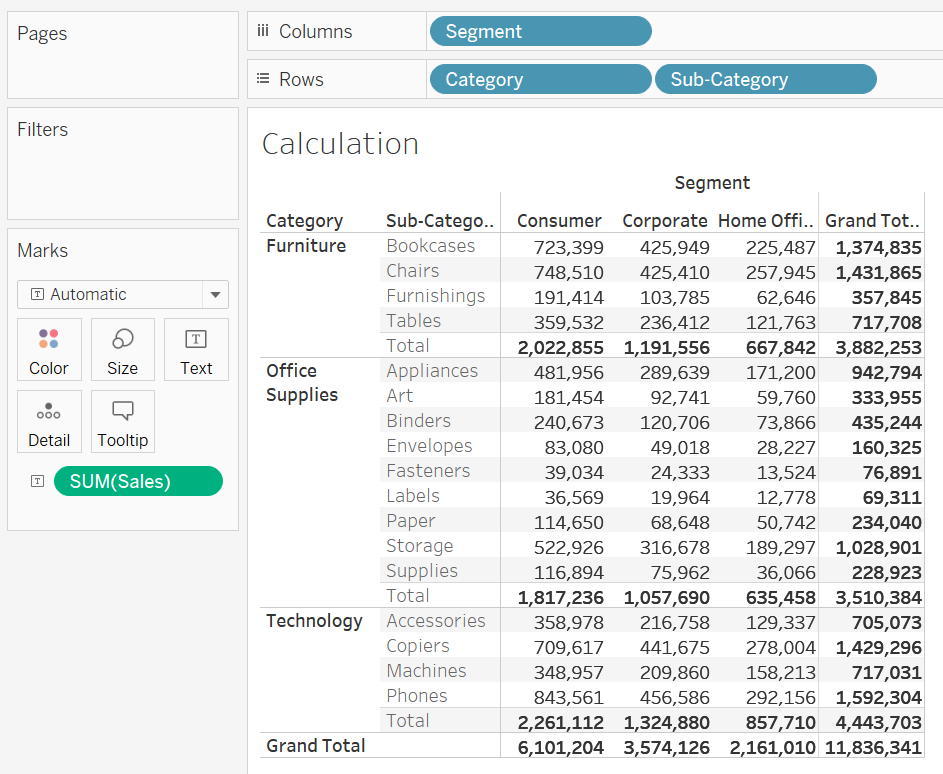
If there is more than one dimension for which the subtotals are being calculated, then we can right-click on the dimensions to select or unselect, depending on whether we want the totals to be calculated or not.

For example, adding city to...

Unlock full access

Continue reading for free

A Packt free trial gives you instant online access to our library of over 7000 practical eBooks and videos, constantly updated with the latest in tech

Create a Note

Modal Close icon
You need to login to use this feature.
notes
bookmark search playlist download font-size

Change the font size

margin-width

Change margin width

day-mode

Change background colour

Close icon Search
Country selected

Close icon Your notes and bookmarks

Delete Bookmark

Modal Close icon
Are you sure you want to delete it?
Cancel
Yes, Delete

Delete Note

Modal Close icon
Are you sure you want to delete it?
Cancel
Yes, Delete

Edit Note

Modal Close icon
Write a note (max 255 characters)
Cancel
Update Note

Confirmation

Modal Close icon
claim successful

Buy this book with your credits?

Modal Close icon
Are you sure you want to buy this book with one of your credits?
Close
YES, BUY