Sign In Start Free Trial
Account

Add to playlist

Create a Playlist

Modal Close icon
You need to login to use this feature.
  • Book Overview & Buying Tableau Desktop Certified Associate: Exam Guide
  • Table Of Contents Toc
  • Feedback & Rating feedback
Tableau Desktop Certified Associate: Exam Guide

Tableau Desktop Certified Associate: Exam Guide

By : Dmitry Anoshin, JC Gillet , Peri, Biyani, Makarenko
3.7 (7)
close
close
Tableau Desktop Certified Associate: Exam Guide

Tableau Desktop Certified Associate: Exam Guide

3.7 (7)
By: Dmitry Anoshin, JC Gillet , Peri, Biyani, Makarenko

Overview of this book

The Tableau Desktop Certified Associate exam measures your knowledge of Tableau Desktop and your ability to work with data and data visualization techniques. This book will help you to become well-versed in Tableau software and use its business intelligence (BI) features to solve BI and analytics challenges. With the help of this book, you'll explore the authors' success stories and their experience with Tableau. You'll start by understanding the importance of Tableau certification and the different certification exams, along with covering the exam format, Tableau basics, and best practices for preparing data for analysis and visualization. The book builds on your knowledge of advanced Tableau topics such as table calculations for solving problems. You'll learn to effectively visualize geographic data using vector maps. Later, you'll discover the analytics capabilities of Tableau by learning how to use features such as forecasting. Finally, you'll understand how to build and customize dashboards, while ensuring they convey information effectively. Every chapter has examples and tests to reinforce your learning, along with mock tests in the last section. By the end of this book, you'll be able to efficiently prepare for the certification exam with the help of mock tests, detailed explanations, and expert advice from the authors.
Table of Contents (15 chapters)
close
close
Free Chapter
1
Section 1: Getting Started with Tableau
3
Section 2: Answering Questions with Data
8
Section 3: Advanced Tableau
13
Mock Test A + B (Assessment)

Key charts in Tableau

Tableau provides a variety of charts that are super quick and easy to create. All charts in Tableau are created based on marks, where marks are the rows in your dataset for any given combination of dimensions and measures. To create a chart, you have two broad options:

  • Select the dimensions and measures you want to plot and click on the Show me window. The Show Me window is a special window where all of the default charts in Tableau and their details can be found. For example, select Category from Dimensions and Sales from Measures. Use the Ctrl key (the Command key on macOS) to select multiple elements.

The Show Me window can be seen in the following screenshot:

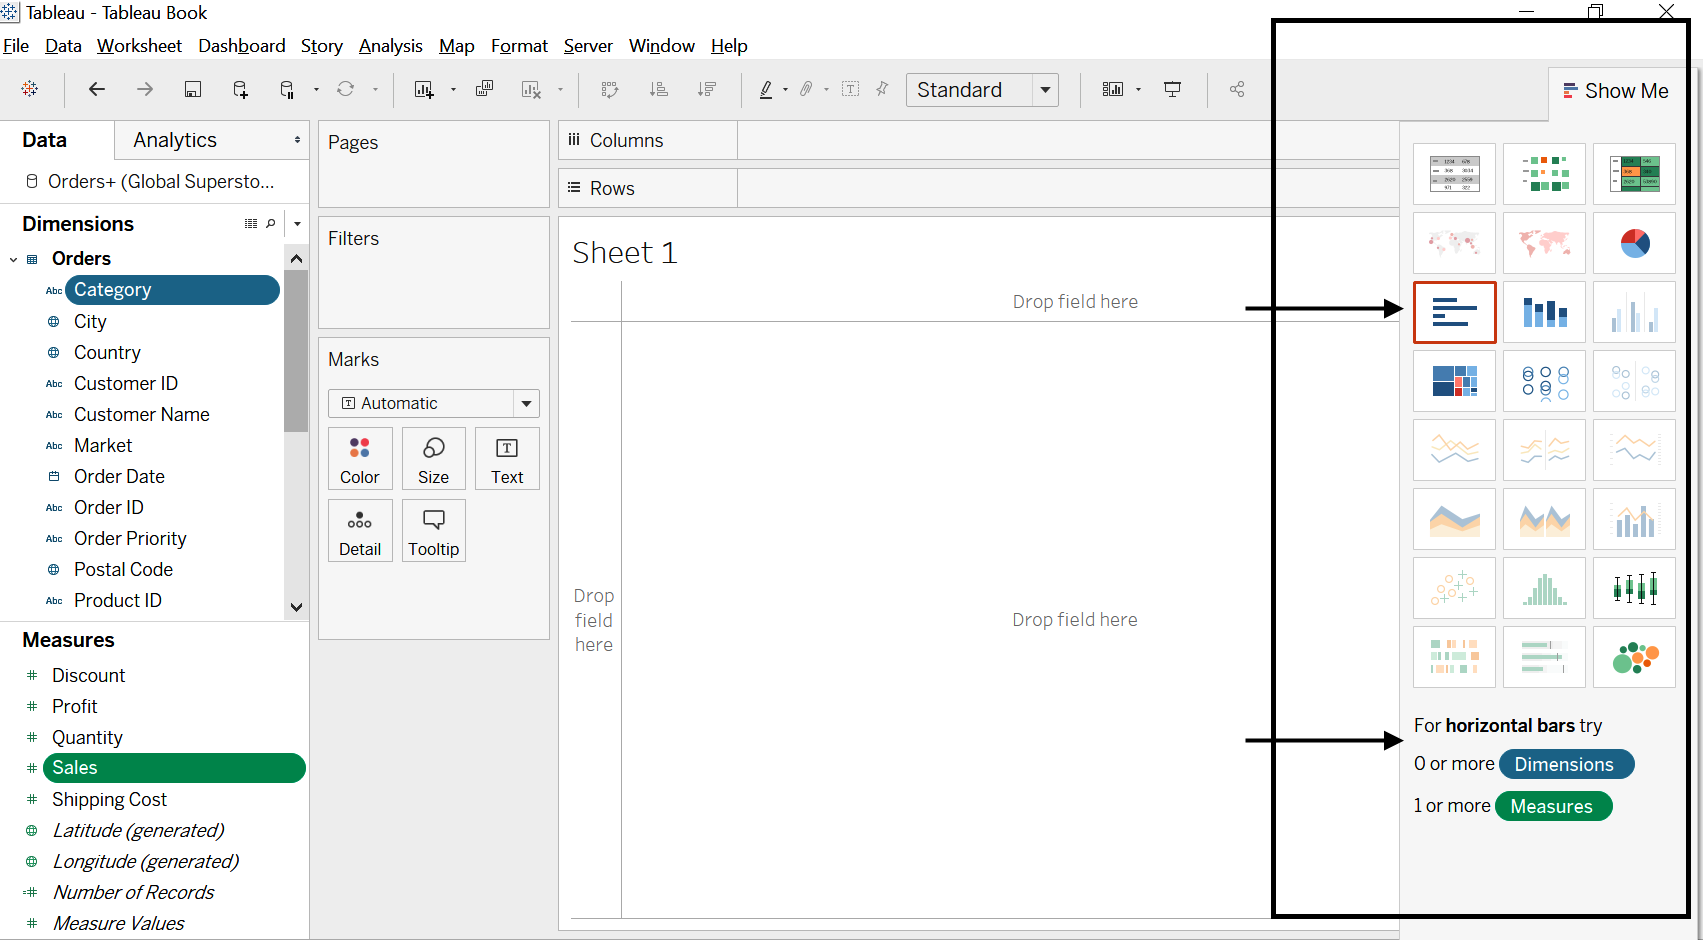
As you can see, the Show Me window currently contains 24 graphs. However, only one is highlighted with an red square around it, seven others are activated, and the rest are grayed out. The highlighted...

Unlock full access

Continue reading for free

A Packt free trial gives you instant online access to our library of over 7000 practical eBooks and videos, constantly updated with the latest in tech

Create a Note

Modal Close icon
You need to login to use this feature.
notes
bookmark search playlist download font-size

Change the font size

margin-width

Change margin width

day-mode

Change background colour

Close icon Search
Country selected

Close icon Your notes and bookmarks

Delete Bookmark

Modal Close icon
Are you sure you want to delete it?
Cancel
Yes, Delete

Delete Note

Modal Close icon
Are you sure you want to delete it?
Cancel
Yes, Delete

Edit Note

Modal Close icon
Write a note (max 255 characters)
Cancel
Update Note

Confirmation

Modal Close icon
claim successful

Buy this book with your credits?

Modal Close icon
Are you sure you want to buy this book with one of your credits?
Close
YES, BUY