Sign In Start Free Trial
Account

Add to playlist

Create a Playlist

Modal Close icon
You need to login to use this feature.
  • Book Overview & Buying Hands-On Business Intelligence with DAX
  • Table Of Contents Toc
  • Feedback & Rating feedback
Hands-On Business Intelligence with DAX

Hands-On Business Intelligence with DAX

By : Horne
5 (3)
close
close
Hands-On Business Intelligence with DAX

Hands-On Business Intelligence with DAX

5 (3)
By: Horne

Overview of this book

Data Analysis Expressions (DAX) is known for its ability to increase efficiency by extracting new information from data that is already present in your model. With this book, you’ll learn to use DAX’s functionality and flexibility in the BI and data analytics domains. You’ll start by learning the basics of DAX, along with understanding the importance of good data models, and how to write efficient DAX formulas by using variables and formatting styles. You’ll then explore how DAX queries work with the help of examples. The book will guide you through optimizing the BI workflow by writing powerful DAX queries. Next, you’ll learn to manipulate and load data of varying complexity within Microsoft products such as Power BI, SQL Server, and Excel Power Pivot. You’ll then discover how to build and extend your data models to gain additional insights, before covering progressive DAX syntax and functions to understand complex relationships in DAX. Later, you’ll focus on important DAX functions, specifically those related to tables, date and time, filtering, and statistics. Finally, you’ll delve into advanced topics such as how the formula and storage engines work to optimize queries. By the end of this book, you’ll have gained hands-on experience in employing DAX to enhance your data models by extracting new information and gaining deeper insights.
Table of Contents (18 chapters)
close
close
1
Section 1: Introduction to DAX for the BI Pro
7
Section 2: Understanding DAX Functions and Syntax
14
Section 3: Taking DAX to the Next Level

Using Power BI Performance Analyzer

For the last section in this chapter, we are going to look at the Performance Analyzer feature in Power BI Desktop. This feature gives information on how elements of a report, such as visuals and DAX queries, are performing.

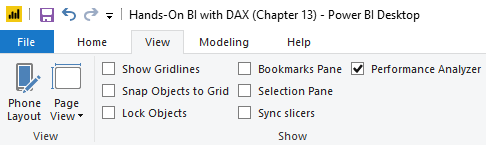
To display the Performance Analyzer pane, click on the Performance Analyzer checkbox on the Show section of the View ribbon, as shown in Figure 13-16:

Figure 13-16: Enabling the performance analyzer feature in Power BI Desktop

Once checked, the Performance Analyzer pane will be displayed to the right of the report desktop. From here, you can start recording data and see information on the processing times required to update report elements when a user interacts with a report. For example, if you alter a slicer, click on a visual, or adjust a filter, then it will send a query to the data model. Information on the action...

Unlock full access

Continue reading for free

A Packt free trial gives you instant online access to our library of over 7000 practical eBooks and videos, constantly updated with the latest in tech

Create a Note

Modal Close icon
You need to login to use this feature.
notes
bookmark search playlist download font-size

Change the font size

margin-width

Change margin width

day-mode

Change background colour

Close icon Search
Country selected

Close icon Your notes and bookmarks

Delete Bookmark

Modal Close icon
Are you sure you want to delete it?
Cancel
Yes, Delete

Delete Note

Modal Close icon
Are you sure you want to delete it?
Cancel
Yes, Delete

Edit Note

Modal Close icon
Write a note (max 255 characters)
Cancel
Update Note

Confirmation

Modal Close icon
claim successful

Buy this book with your credits?

Modal Close icon
Are you sure you want to buy this book with one of your credits?
Close
YES, BUY