-
Book Overview & Buying
-
Table Of Contents

-
Feedback & Rating

Microsoft Power BI Cookbook
By :
Microsoft Power BI Cookbook
By:
Overview of this book
Since its first edition the Power BI Cookbook has been a best-selling resource for BI developers and data analysts to produce impactful, quality BI solutions. This new and updated edition retains the rigorous details and concepts readers of prior editions have enjoyed while also demonstrating powerful new capabilities and updated guidance aligned to the current state of the platform.
In this book, with step-by-step instructions, you will learn to navigate the complexities of data integration and visualization in Power BI. From creating robust data models to implementing sophisticated reporting techniques, this Power BI book empowers you to make informed decisions based on actionable insights. It also introduces you to new capabilities such as Hybrid tables and scorecards, enhancing your ability to communicate and analyze business performance. It also expands and improvises on the core of the previous edition like parameterizing Power BI solutions, authoring reports, data intelligence, and integrating advanced analytics.
This edition not only updates you on the latest features but also prepares you for future innovations with a preview of upcoming AI enhancements in Power BI. Whether you're refining your skills or aspiring to become an expert, this book is an invaluable resource for leveraging Power BI to its fullest potential
Table of Contents (16 chapters)
Preface

 Free Chapter
Installing and Licensing Power BI Tools
Accessing, Retrieving, and Transforming Data
Building a Power BI Semantic Model
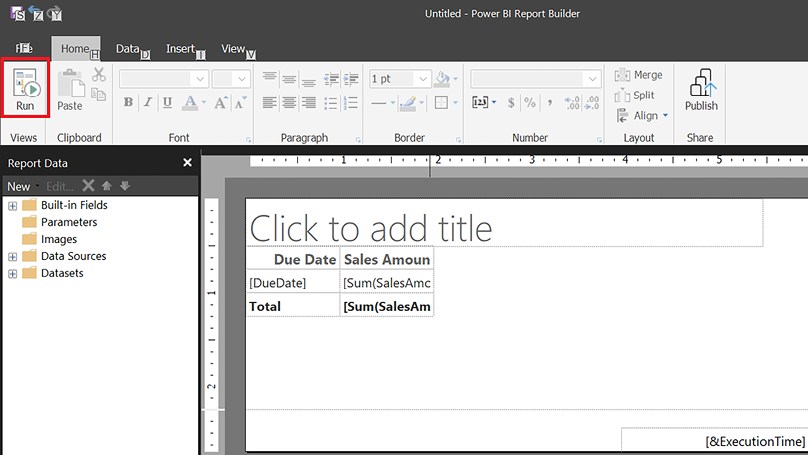
Authoring Power BI Reports
Working in the Power BI Service
Getting Serious About Date Intelligence
Parameterizing Power BI Solutions
Implementing Dynamic User-Based Visibility in Power BI
Applying Advanced Analytics and Custom Visuals
Enhancing and Optimizing Existing Power BI Solutions
Deploying and Distributing Power BI Content
Integrating Power BI with Other Applications
Working with Premium and Microsoft Fabric
Other Books You May Enjoy
Index
Customer Reviews