-
Book Overview & Buying
-
Table Of Contents

-
Feedback & Rating

Data Modeling with Microsoft Excel
By :
Data Modeling with Microsoft Excel
By:
Overview of this book
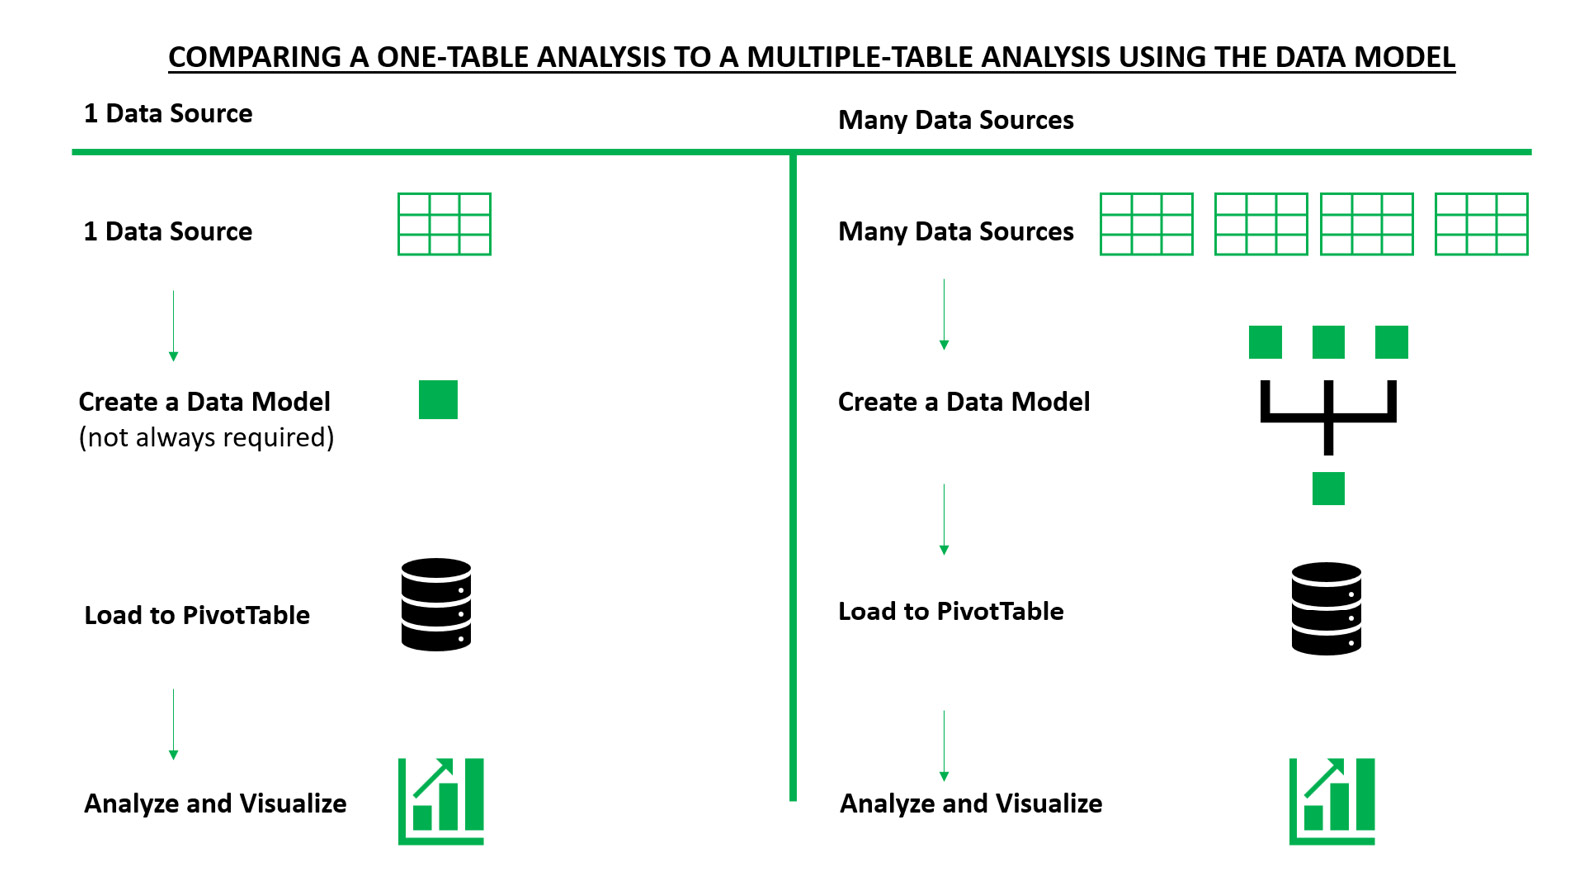
Microsoft Excel's BI solutions have evolved, offering users more flexibility and control over analyzing data directly in Excel. Features like PivotTables, Data Model, Power Query, and Power Pivot empower Excel users to efficiently get, transform, model, aggregate, and visualize data.
Data Modeling with Microsoft Excel offers a practical way to demystify the use and application of these tools using real-world examples and simple illustrations.
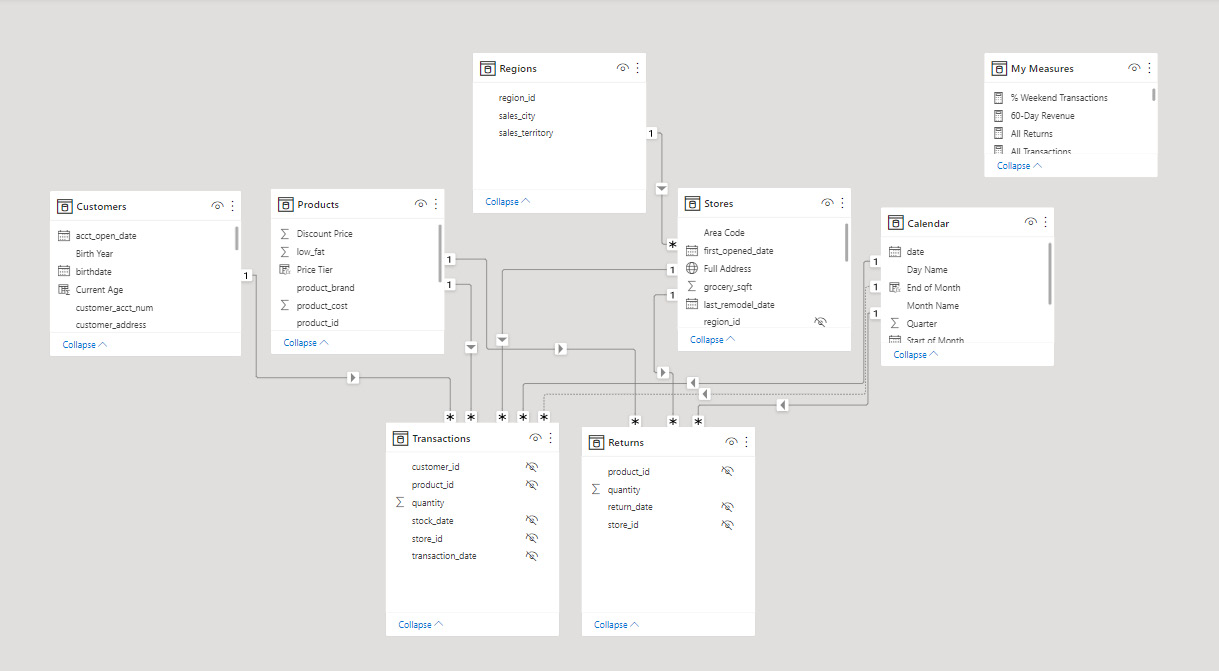
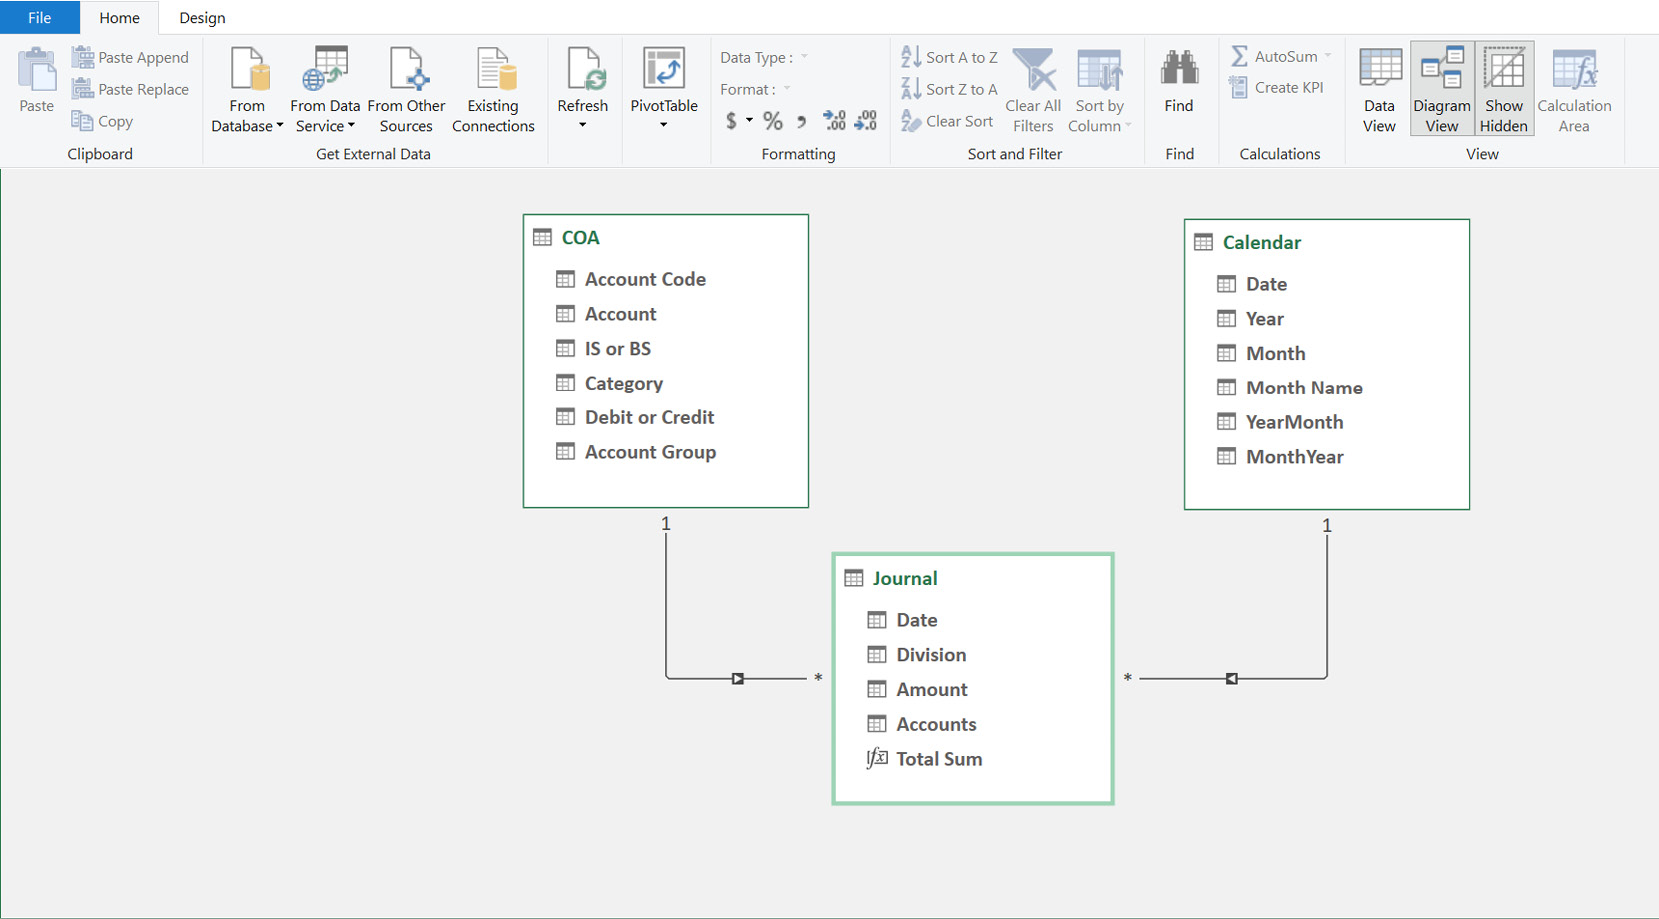
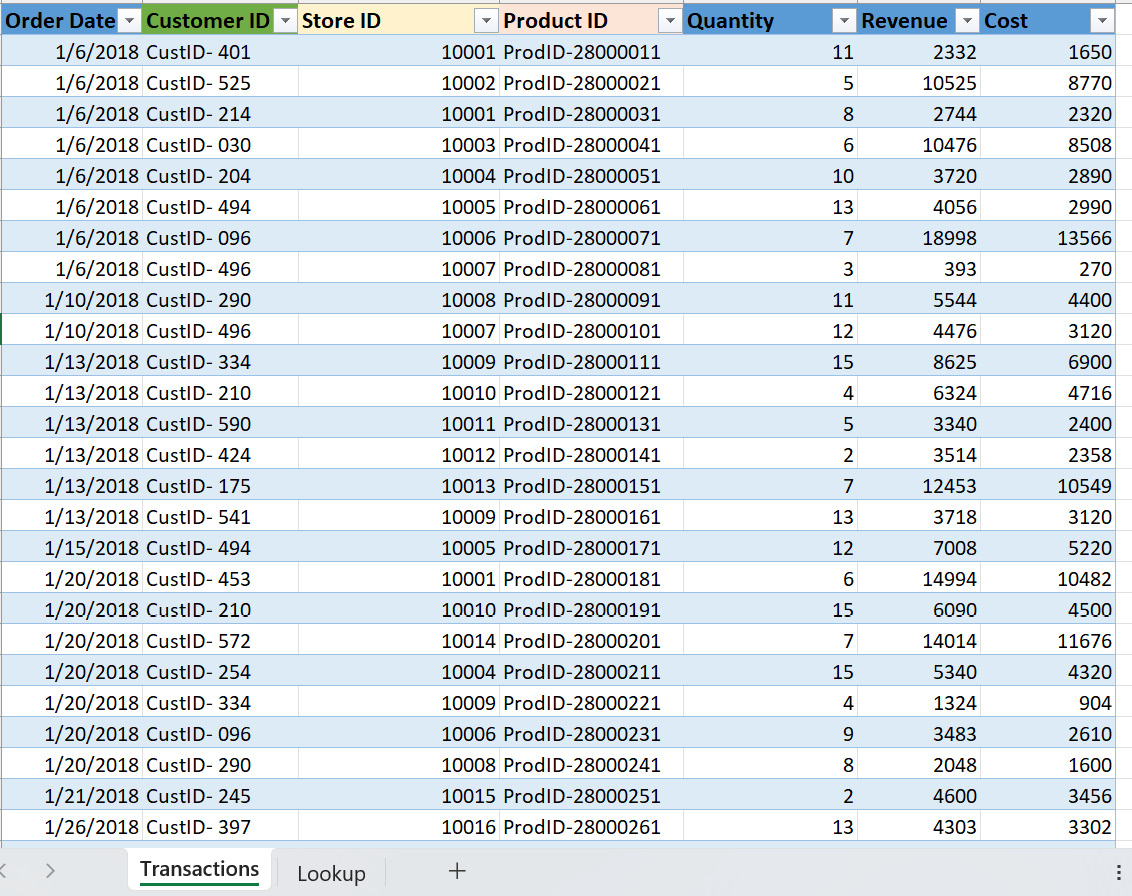
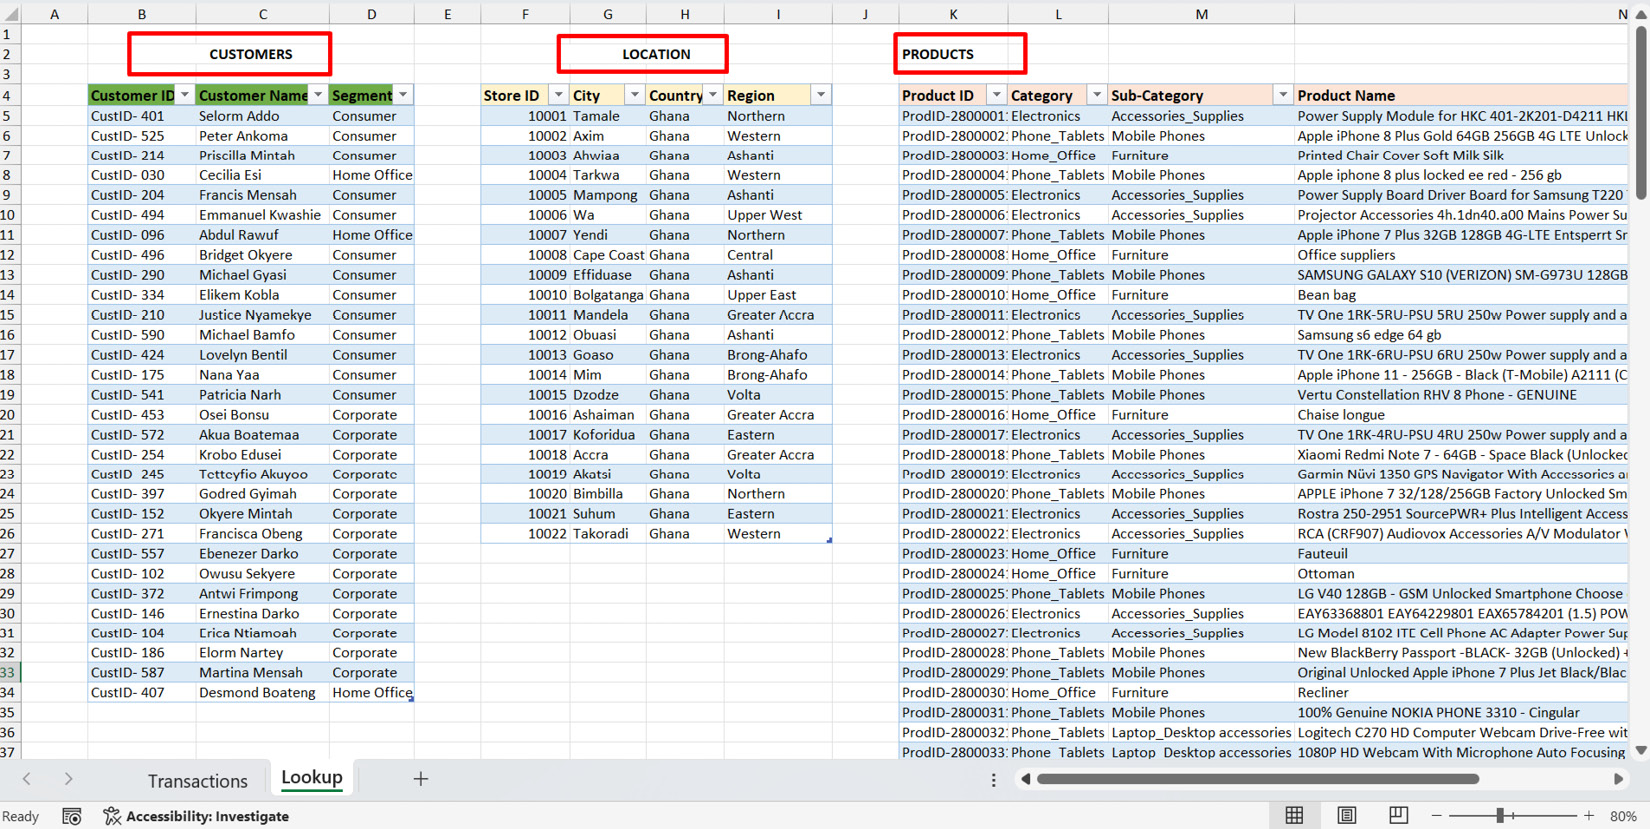
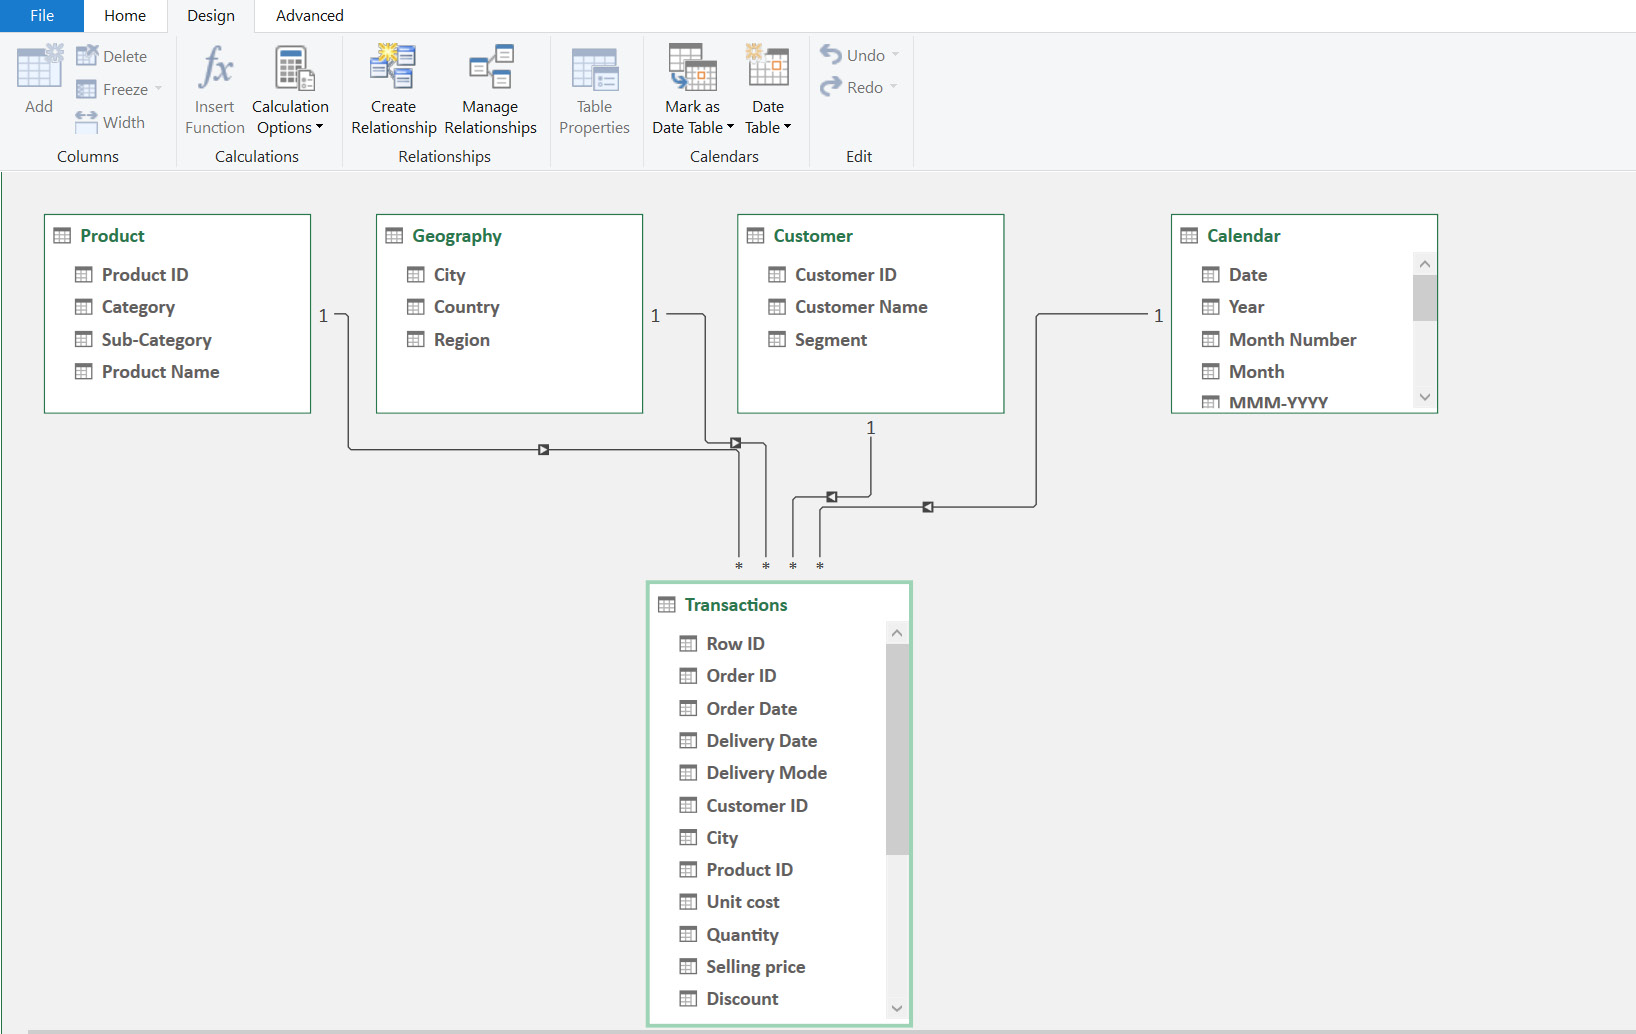
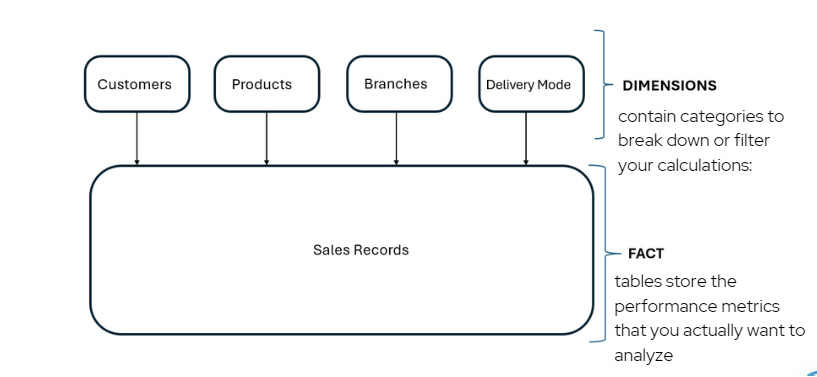
This book will introduce you to the world of data modeling in Excel, as well as definitions and best practices in data structuring for both normalized and denormalized data. The next set of chapters will take you through the useful features of Data Model and Power Pivot, helping you get to grips with the types of schemas (snowflake and star) and create relationships within multiple tables. You’ll also understand how to create powerful and flexible measures using DAX and Cube functions.
By the end of this book, you’ll be able to apply the acquired knowledge in real-world scenarios and build an interactive dashboard that will help you make important decisions.
Note: To access the supplemental material, subscribers should purchase a print copy of the book. The ebook can be accessed through the QR code or link provided inside the Print book. Proof of purchase is mandatory to access the ebook.
Table of Contents (16 chapters)
Preface

Part 1: Overview and Introduction to Data Modeling in Microsoft Excel
 Free Chapter
Chapter 1: Getting Started with Data Modeling – Overview and Importance
Chapter 2: Data Structuring for
Data Models – What’s the best way to layout your data?
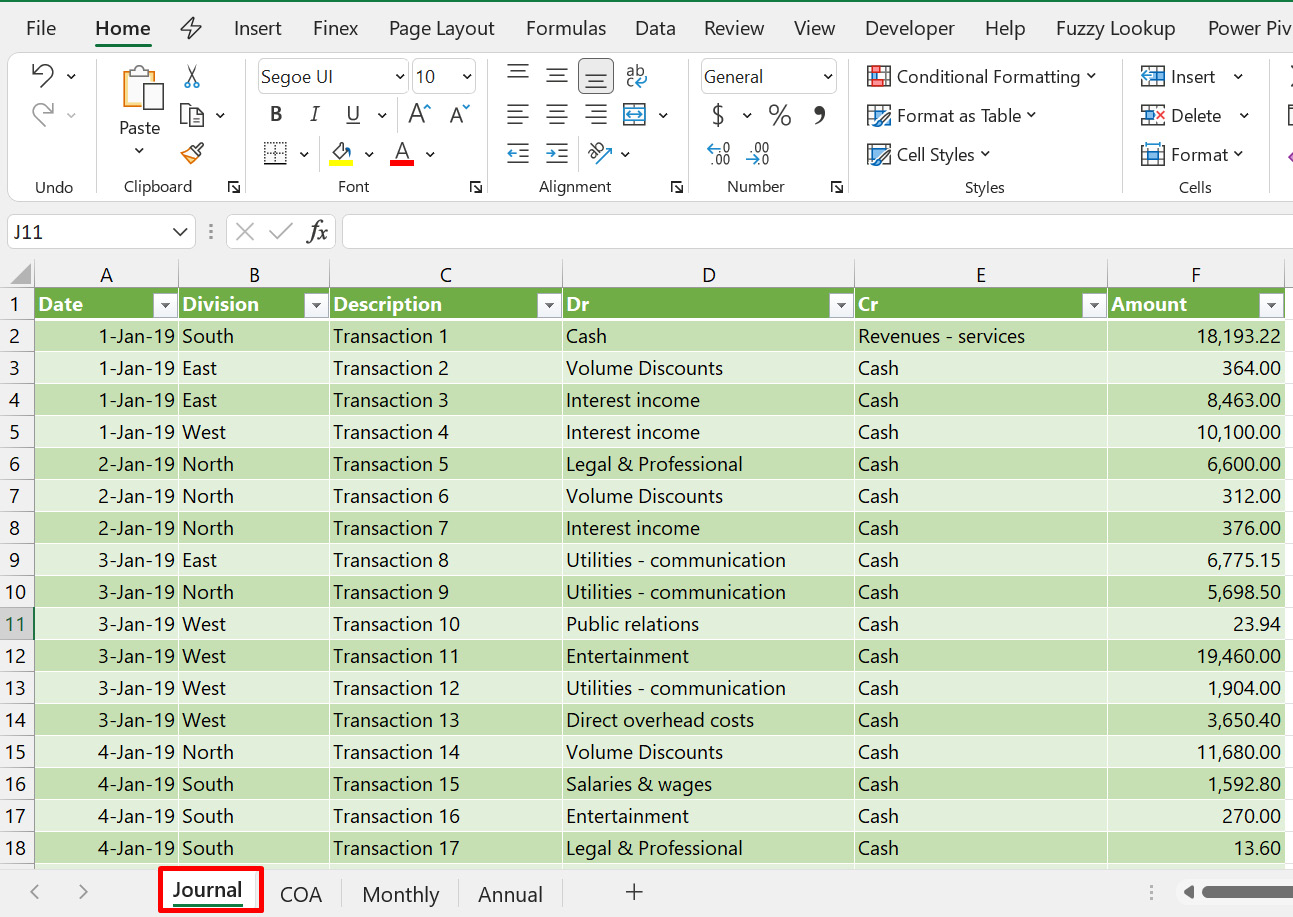
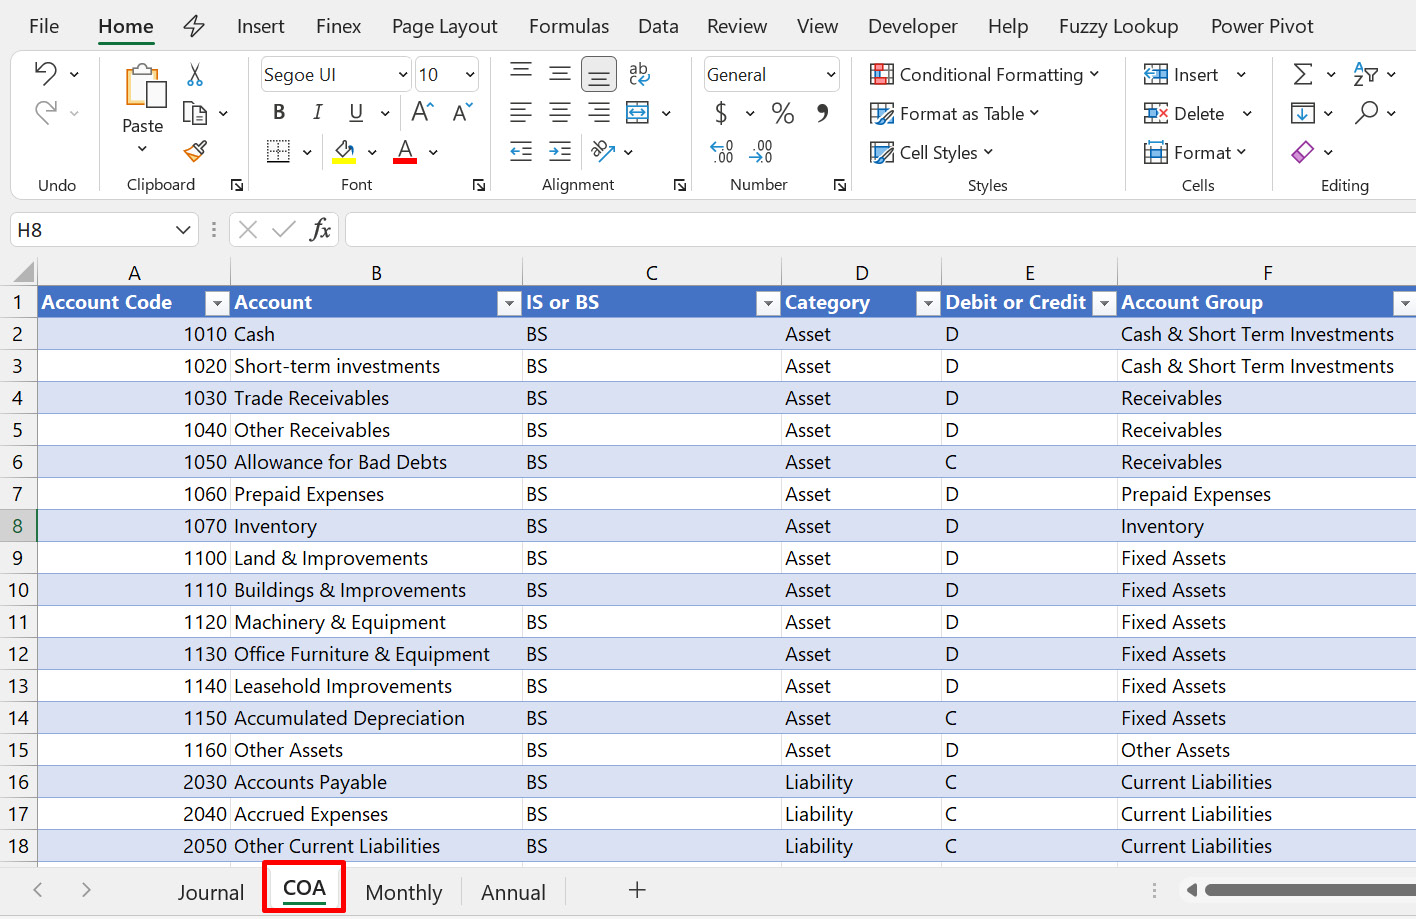
Chapter 3: Preparing Your Data for the Data Model – Cleaning and Transforming Your Data Using Power Query
Chapter 4: Data Modeling with Power Pivot – Understanding How to Combine and Analyze Multiple Tables Using the Data Model
Part 2: Creating Insightful Calculations from your Data Model using DAX and Cube Functions
Chapter 5: Creating DAX Calculations from Your Data Model – Introduction to Measures and Calculated Columns
Chapter 6: Creating Cube Functions from Your Data Model – a Flexible Alternative to Calculations in Your Data Model
Part 3: Putting it all together with a Dashboard
Chapter 7: Communicating Insights from Your Data Model Using Dashboards – Overview and Uses
Chapter 8: Visualization Elements for Your Dashboard – Slicers, PivotCharts, Conditional Formatting, and Shapes
Chapter 9: Choosing the Right Design Themes – Less Is More
with Colors
Chapter 10: Publication and Deployment – Sharing with Report Users
Index
Customer Reviews