-
Book Overview & Buying
-
Table Of Contents

-
Feedback & Rating

Splunk 9.x Enterprise Certified Admin Guide
By :
Splunk 9.x Enterprise Certified Admin Guide
By:
Overview of this book
The IT sector's appetite for Splunk and skilled Splunk developers continues to surge, offering more opportunities for developers with each passing decade. If you want to enhance your career as a Splunk Enterprise administrator, then Splunk 9.x Enterprise Certified Admin Guide will not only aid you in excelling on your exam but also pave the way for a successful career.
You’ll begin with an overview of Splunk Enterprise, including installation, license management, user management, and forwarder management. Additionally, you’ll delve into indexes management, including the creation and management of indexes used to store data in Splunk. You’ll also uncover config files, which are used to configure various settings and components in Splunk.
As you advance, you’ll explore data administration, including data inputs, which are used to collect data from various sources, such as log files, network protocols (TCP/UDP), APIs, and agentless inputs (HEC).
You’ll also discover search-time and index-time field extraction, used to create reports and visualizations, and help make the data in Splunk more searchable and accessible. The self-assessment questions and answers at the end of each chapter will help you gauge your understanding.
By the end of this book, you’ll be well versed in all the topics required to pass the Splunk Enterprise Admin exam and use Splunk features effectively.
Table of Contents (17 chapters)
Preface

Part 1: Splunk System Administration
 Free Chapter
Chapter 1: Getting Started with the Splunk Enterprise Certified Admin Exam
Chapter 2: Splunk License Management
Chapter 3: Users, Roles, and Authentication in Splunk
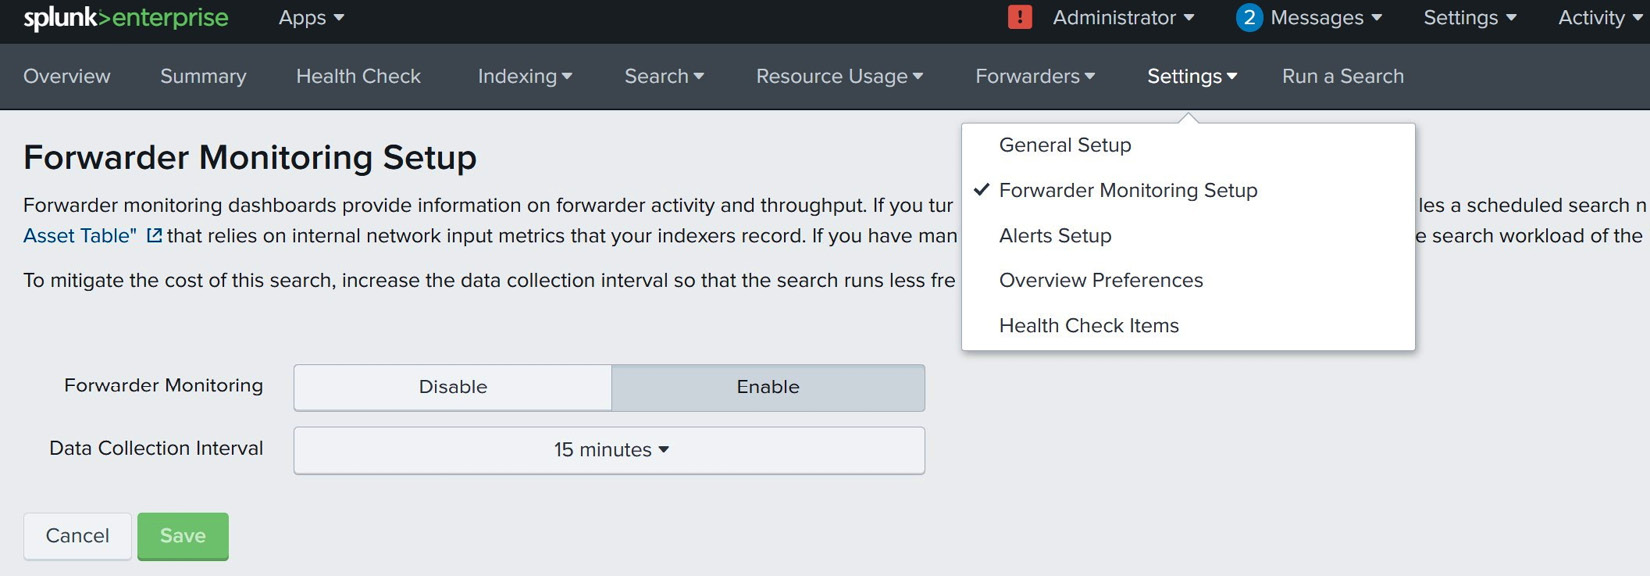
Chapter 4: Splunk Forwarder Management
Chapter 5: Splunk Index Management
Chapter 6: Splunk Configuration Files
Chapter 7: Exploring Distributed Search
Part 2:Splunk Data Administration
Chapter 8: Getting Data In
Chapter 9: Configuring Splunk Data Inputs
Chapter 10: Data Parsing and Transformation
Chapter 11: Field Extractions and Lookups
Chapter 12: Self-Assessment Mock Exam
Index
Customer Reviews