-
Book Overview & Buying

-
Table Of Contents

-
Feedback & Rating

Getting Started with Tableau 2018.x
By :
Getting Started with Tableau 2018.x
By:
Overview of this book
Tableau is one of the leading business intelligence tools used worldwide, in organizations of every scale. In its latest release, Tableau 2018 promises richer and more useful features related to visual analytics, reporting, dashboarding, and a host of other data visualization aspects. Getting Started with Tableau 2018.x will get you up and running with these features.
The book starts with all the new functionalities of the different Tableau 2018 versions, along with concrete examples of how to use them. However, if you're new to Tableau, don't worry! The rest of the book will guide you through each major aspect of Tableau with examples. You'll learn how to connect to data, build a data source, visualize your data, build a dashboard, and share it online. In the final chapters, you'll also learn advanced techniques such as creating a cross-database join, data blending, and more.
By the end of the book, you will have a firm understanding of how to effectively use Tableau to create quick, cost-effective, and business-efficient business intelligence solutions.
Table of Contents (16 chapters)
Preface

 Free Chapter
Catching Up with Tableau 2018
The Tableau Core
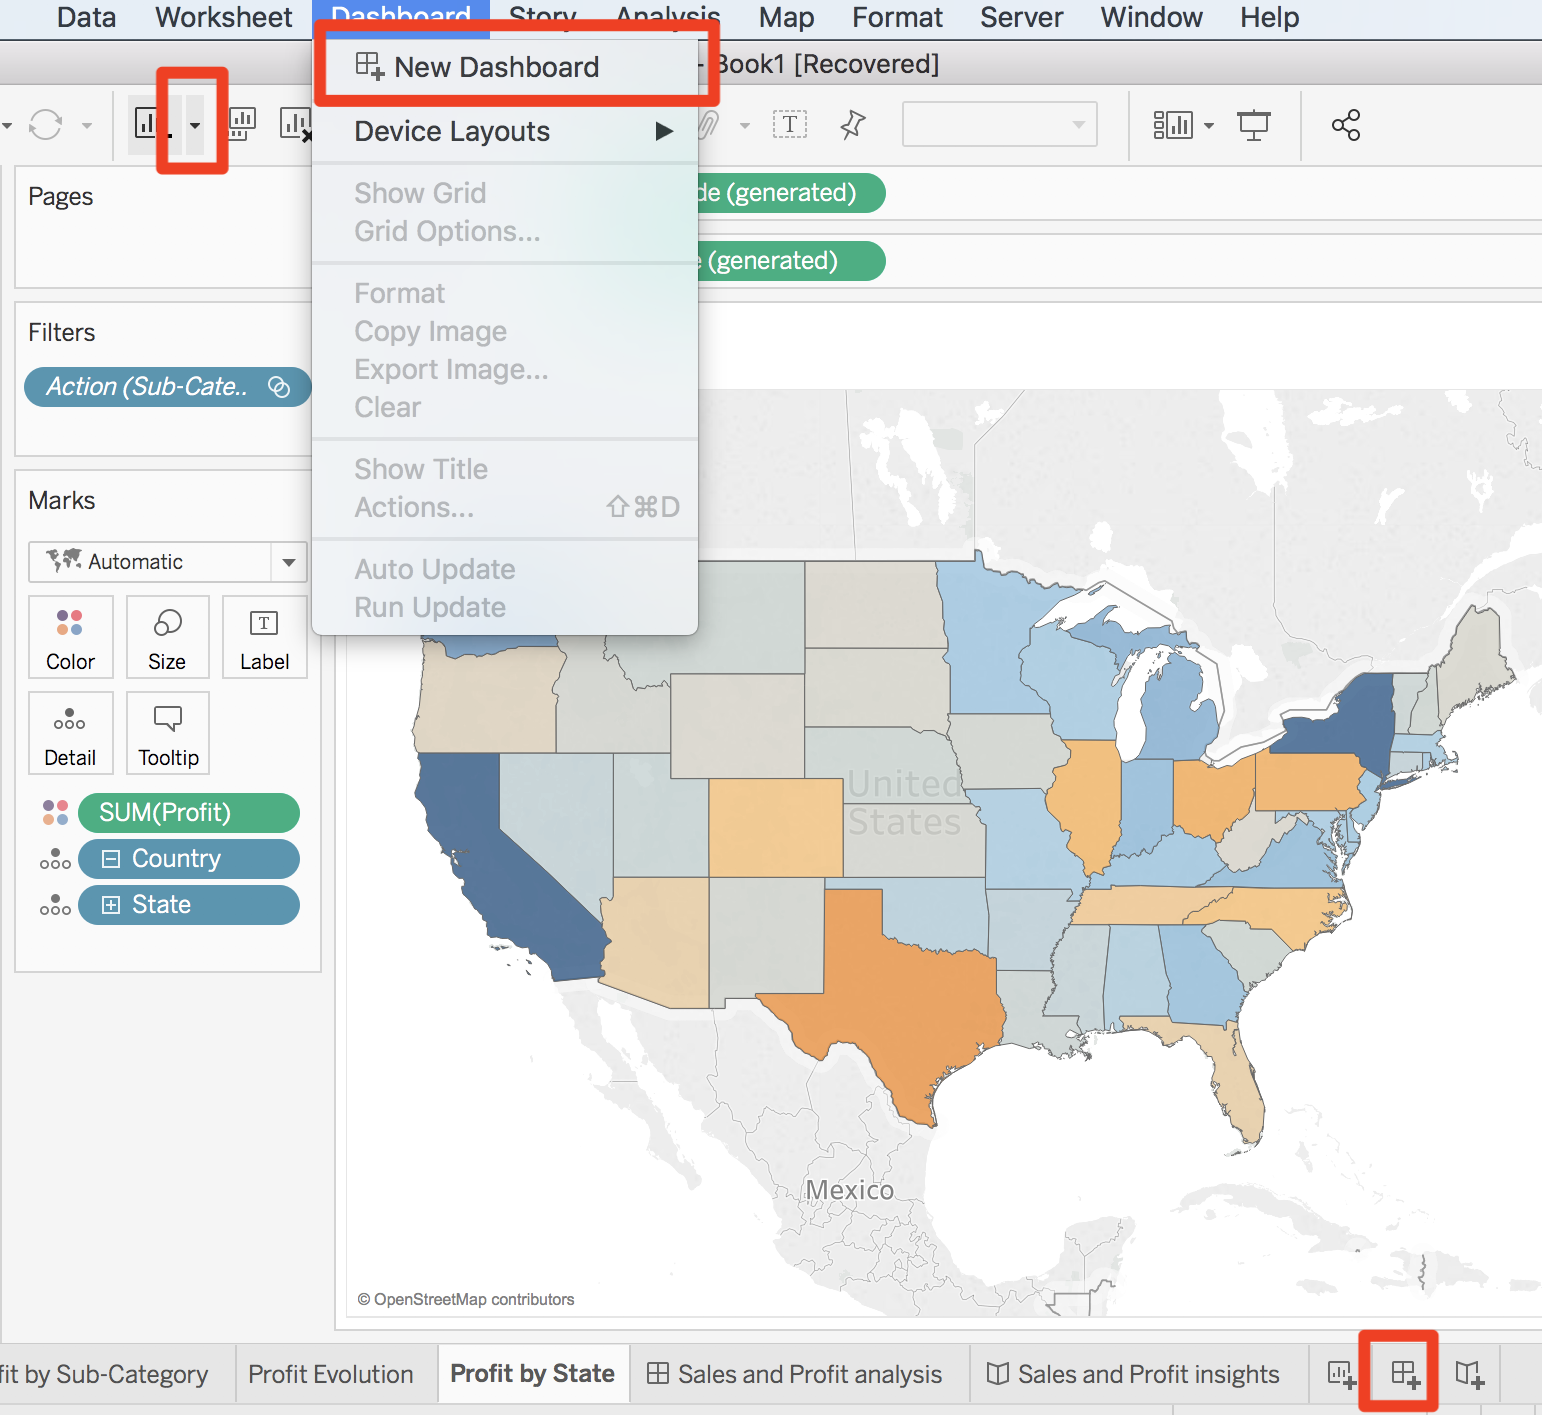
A First Dashboard and Exploration
Connect to Data and Simple Transformations
Build an Efficient Data Source
Design Insightful Visualizations - Part 1
Design Insightful Visualizations - Part 2
Create Powerful Dashboards and Stories
Publish and Interact in Tableau Server
An Introduction to Calculations
Analytics and Parameters
Advanced Data Connections
Deal with Security
How to Keep Growing Your Skills
Other Books You May Enjoy
Customer Reviews