Sign In Start Free Trial
Account

Add to playlist

Create a Playlist

Modal Close icon
You need to login to use this feature.
  • Book Overview & Buying Getting Started with Tableau 2018.x
  • Table Of Contents Toc
  • Feedback & Rating feedback
Getting Started with Tableau 2018.x

Getting Started with Tableau 2018.x

By : Guillevin, Pires
4 (3)
close
close
Getting Started with Tableau 2018.x

Getting Started with Tableau 2018.x

4 (3)
By: Guillevin, Pires

Overview of this book

Tableau is one of the leading business intelligence tools used worldwide, in organizations of every scale. In its latest release, Tableau 2018 promises richer and more useful features related to visual analytics, reporting, dashboarding, and a host of other data visualization aspects. Getting Started with Tableau 2018.x will get you up and running with these features. The book starts with all the new functionalities of the different Tableau 2018 versions, along with concrete examples of how to use them. However, if you're new to Tableau, don't worry! The rest of the book will guide you through each major aspect of Tableau with examples. You'll learn how to connect to data, build a data source, visualize your data, build a dashboard, and share it online. In the final chapters, you'll also learn advanced techniques such as creating a cross-database join, data blending, and more. By the end of the book, you will have a firm understanding of how to effectively use Tableau to create quick, cost-effective, and business-efficient business intelligence solutions.
Table of Contents (16 chapters)
close
close
Free Chapter
1
Catching Up with Tableau 2018

 The different Mark types

The highlighted menu lets you choose the Mark type, as shown in the following screenshot:

By default, the Mark type is set to Automatic. This means that Tableau chooses the best visualization based on the fields (where and which data types you use). For example, if you use a Date and a Measure, Tableau chooses a Line because it's the best way to visualize an evolution. 

Of course, you can change the Mark type and use any type you want. For example, if you put Order Date in Columns and Profit in Rows, Tableau displays a Line chart. However, by using the Mark type menu, you can select the one you prefer (a Bar chart, an Area chart, or whatever you think is best).

Here's a list of the different Mark types:
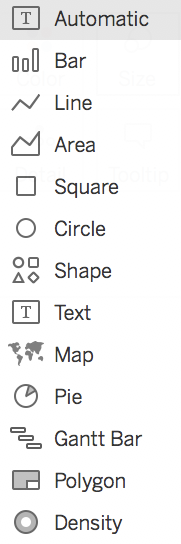
The last one...

Unlock full access

Continue reading for free

A Packt free trial gives you instant online access to our library of over 7000 practical eBooks and videos, constantly updated with the latest in tech

Create a Note

Modal Close icon
You need to login to use this feature.
notes
bookmark search playlist download font-size

Change the font size

margin-width

Change margin width

day-mode

Change background colour

Close icon Search
Country selected

Close icon Your notes and bookmarks

Delete Bookmark

Modal Close icon
Are you sure you want to delete it?
Cancel
Yes, Delete

Delete Note

Modal Close icon
Are you sure you want to delete it?
Cancel
Yes, Delete

Edit Note

Modal Close icon
Write a note (max 255 characters)
Cancel
Update Note

Confirmation

Modal Close icon
claim successful

Buy this book with your credits?

Modal Close icon
Are you sure you want to buy this book with one of your credits?
Close
YES, BUY