-
Book Overview & Buying
-
Table Of Contents

-
Feedback & Rating

Big Data Analytics with Hadoop 3
By :
Big Data Analytics with Hadoop 3
By:
Overview of this book
Apache Hadoop is the most popular platform for big data processing, and can be combined with a host of other big data tools to build powerful analytics solutions. Big Data Analytics with Hadoop 3 shows you how to do just that, by providing insights into the software as well as its benefits with the help of practical examples.
Once you have taken a tour of Hadoop 3’s latest features, you will get an overview of HDFS, MapReduce, and YARN, and how they enable faster, more efficient big data processing. You will then move on to learning how to integrate Hadoop with the open source tools, such as Python and R, to analyze and visualize data and perform statistical computing on big data. As you get acquainted with all this, you will explore how to use Hadoop 3 with Apache Spark and Apache Flink for real-time data analytics and stream processing. In addition to this, you will understand how to use Hadoop to build analytics solutions on the cloud and an end-to-end pipeline to perform big data analysis using practical use cases.
By the end of this book, you will be well-versed with the analytical capabilities of the Hadoop ecosystem. You will be able to build powerful solutions to perform big data analytics and get insight effortlessly.
Table of Contents (13 chapters)
Preface

 Free Chapter
Introduction to Hadoop
Overview of Big Data Analytics
Big Data Processing with MapReduce
Scientific Computing and Big Data Analysis with Python and Hadoop
Statistical Big Data Computing with R and Hadoop
Batch Analytics with Apache Spark
Real-Time Analytics with Apache Spark
Batch Analytics with Apache Flink
Stream Processing with Apache Flink
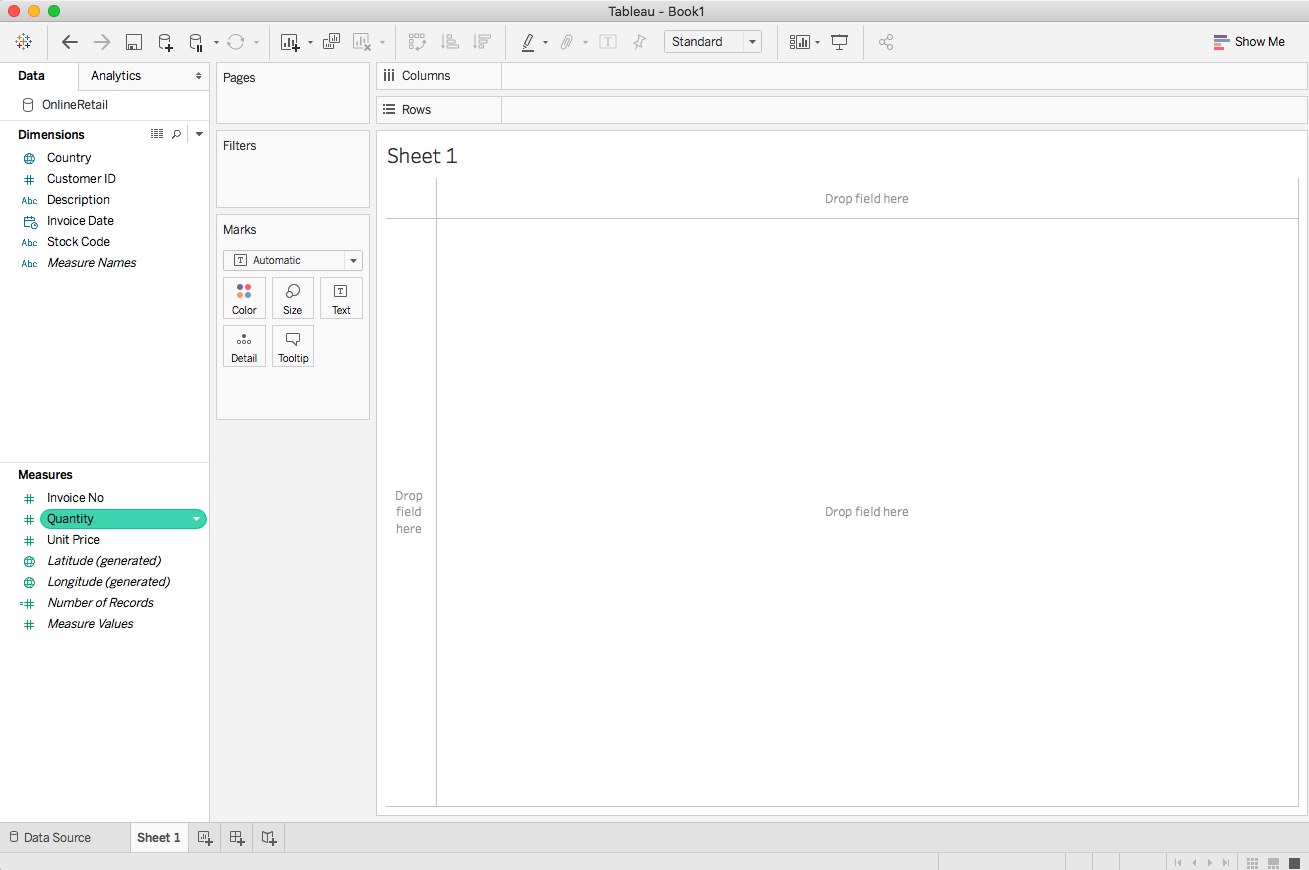
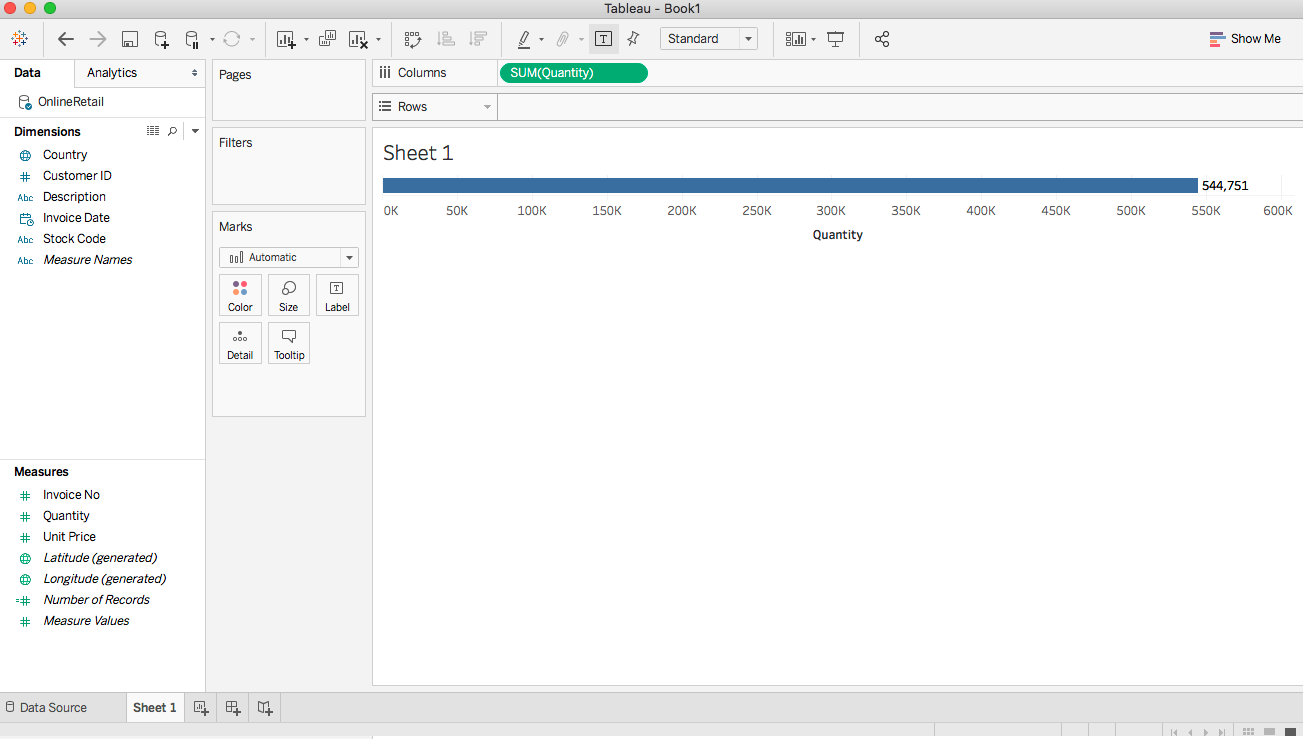
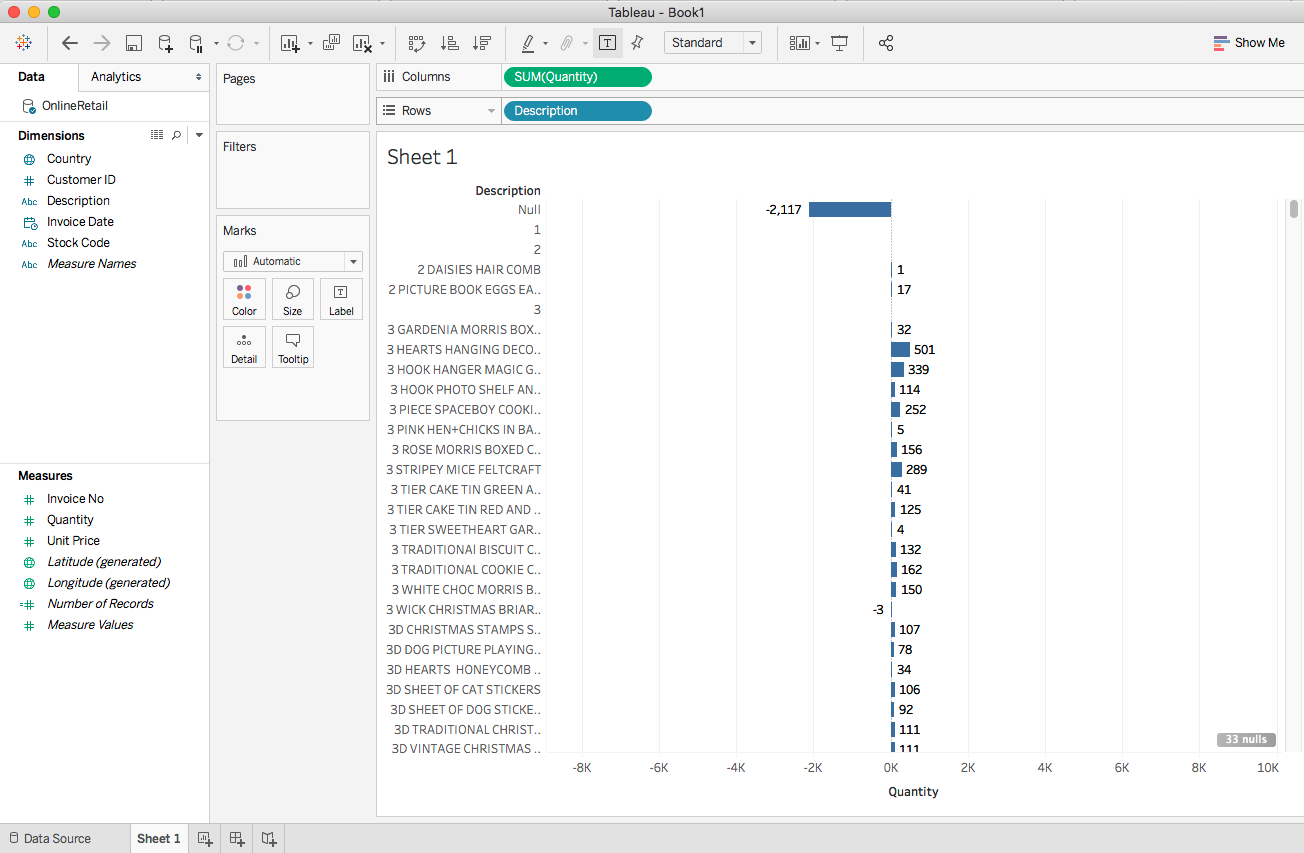
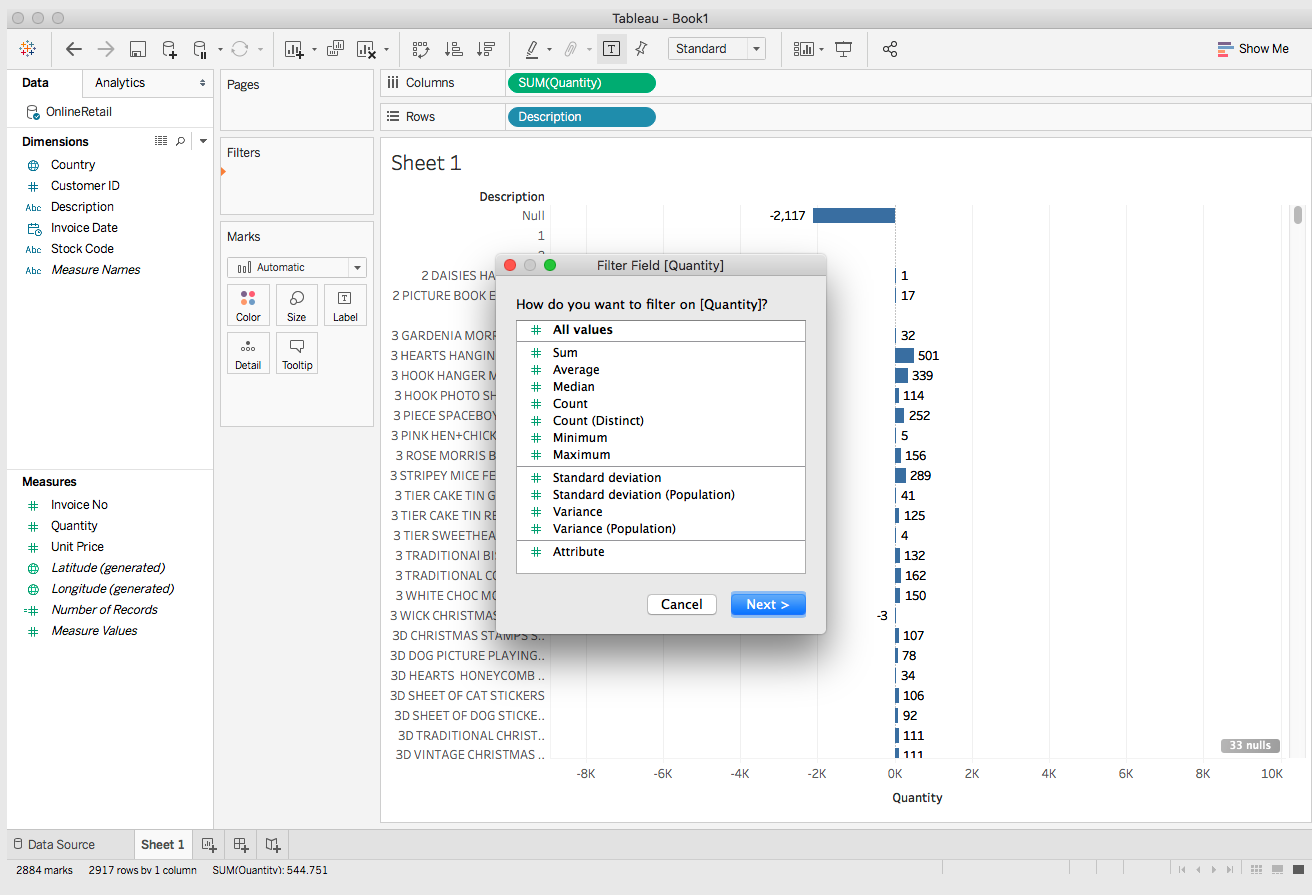
Visualizing Big Data
Introduction to Cloud Computing
Customer Reviews