-
Book Overview & Buying
-
Table Of Contents
-
Feedback & Rating

Advanced Splunk
By :

Once the data is boarded on Splunk, a search is used to create analytics over the indexed data. Here, the faster the search results produced, the more the real-time results will be. Search parallelization is the easiest and most efficient way to speed up transforming searches by adding additional search pipelines on each indexer. This helps in processing of multiple buckets at the same time. Search parallelization can also enable acceleration for a transforming search when saved as a report or report-based dashboard panel.
Underutilized indexers and resources provide us with opportunities to execute multiple search pipelines. Since there is no sharing of states, there exists no dependency across search pipelines among each other. Though underutilized indexers are candidates for search pipeline parallelization, it is always advised not to enable pipeline parallelization if indexers are fully utilized and don't have the bandwidth to handle more processes.
The following figure depicts that search parallelization searches are designed to search and return event data by bucket instead of time. More the search pipelines added, more the search buckets are processed simultaneously, thus increasing the speed of returning the search results. The data between different pipelines is not shared at all. Each pipeline services a single target search bucket and then processes it to send out the search results.
The default value of batch_search_max_pipeline
is 1
, and the maximum recommended value is 2
.
Now, we'll discuss how to configure batch search in a parallel mode. To configure a batch search in a parallel mode, modify the limits.conf
file located at $SPLUNK_HOME\etc\system\local
as:
[search] batch_search_max_pipeline = 2
Note that the value should be increased in multiples of 2
.
This increases the number of threads and thus improves the search performance in terms of retrieving search results.
There have been tremendous improvements in the search scheduler in Splunk 6.3 to improve the search performance and for proper and efficient resource utilization. The following two important improvements were introduced in Splunk 6.3 that reduces lags and fewer skipped searches:
We'll learn how to configure the search scheduler next. Modify the limits.conf
file located at $SPLUNK_HOME\etc\system\local
as follows:
[scheduler] #The ratio of jobs that scheduler can use versus the manual/dashboard jobs. Below settings applies 50% quota for scheduler. Max_searches_perc = 50 # allow value to be 80 anytime on weekends. Max_searches_perc.1 = 80 Maxx_searches_perc.1.when = ****0,6 # Allow value to be 60 between midnight and 5 am. Max_searches_perc.2 = 60 Max_searches_perc.2.when = * 0-5 ***
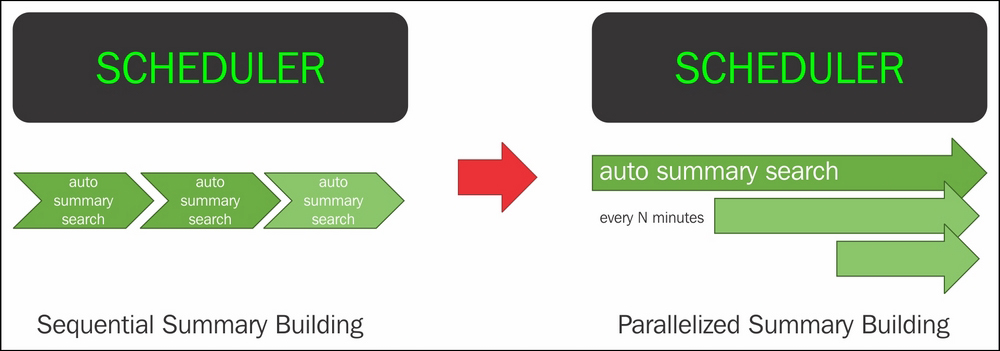
The sequential nature of building summary data for data models and saved reports is very slow, and hence, the summary building process has been parallelized in Splunk 6.3.
As shown in the preceding figure, in the earlier versions of Splunk, the scheduler summary building was sequential. Because of this, one after the other, there was a performance bottleneck. Now, the summary building process has been parallelized, resulting into faster and efficient summary building.
Now we're going to configure summary parallelization. Modify the savedsearches.conf
file located at $SPLUNK_HOME\etc\system\local
as follows:
[default] Auto_summarize.max_concurrent = 3
Then, modify the datamodels.conf
file located at $SPLUNK_HOME\etc\system\local
as follows:
[default] Acceleration.max_concurrent = 2
Change the font size
Change margin width
Change background colour