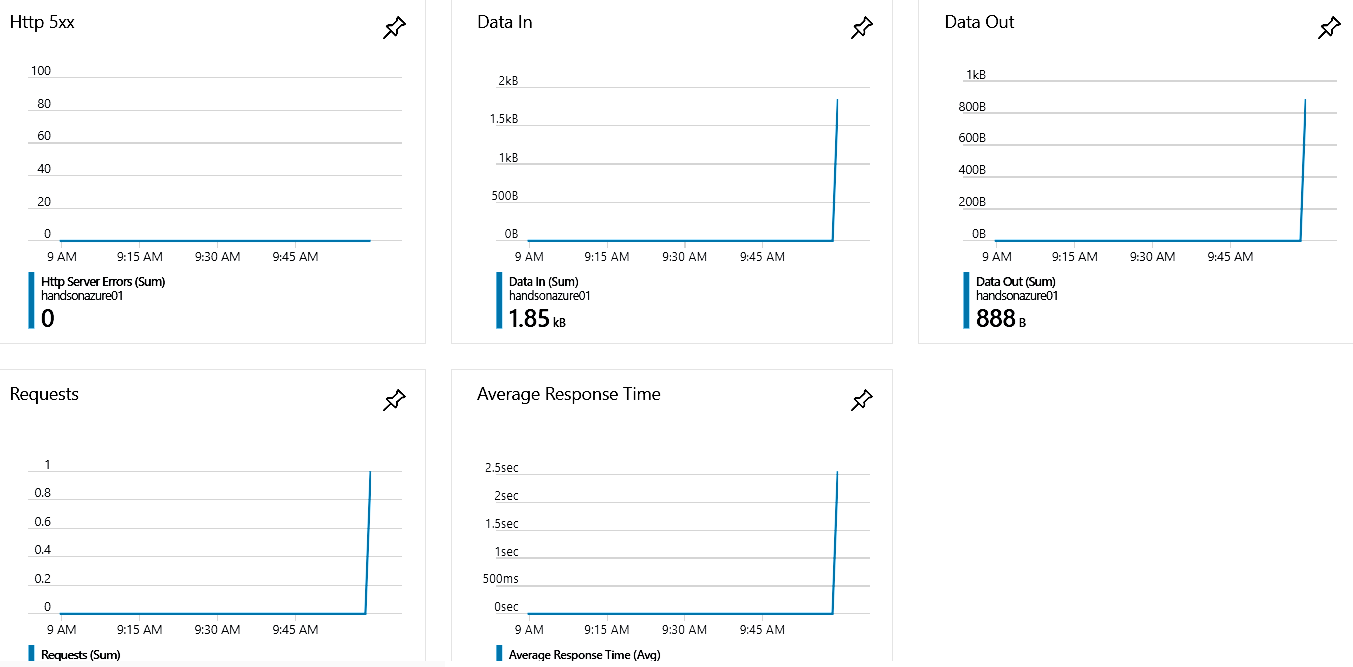
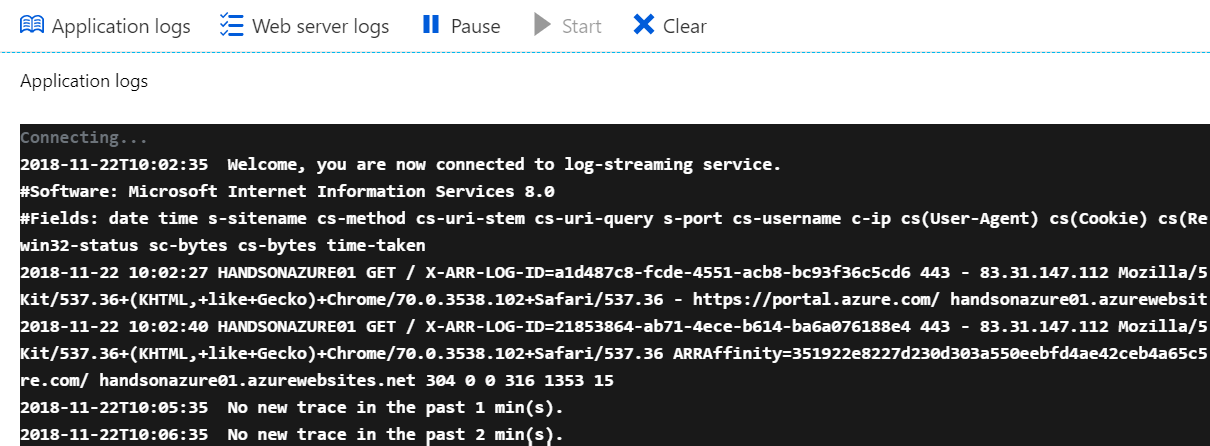
The last section of this chapter will show you how you can diagnose and monitor App Services that you've deployed. Those operations are crucial when you have a working application, as errors and performance issues always crop up, especially in popular services. Thanks to multiple integrated tools in Azure Web Apps, you can be sure that you'll always have enough information to find and fix a problem.
-
Book Overview & Buying
-
Table Of Contents

-
Feedback & Rating

Hands-On Azure for Developers
By :
Hands-On Azure for Developers
By:
Overview of this book
Microsoft Azure is one of the fastest growing public cloud service providers in the market currently, and also holds the second highest market share after AWS. Azure has a sophisticated set of services that will help you build fault-tolerant and scalable cloud-based applications.
Hands-On Azure for Developers will take you on a journey through multiple PaaS services available in Azure, including App Services, Functions, and Service Fabric, and explain in detail how to build a complete and reliable system with ease. You will learn about how to maximize your skills when building cloud-based solutions leveraging different SQL/NoSQL databases, serverless and messaging components, and even search engines such as Azure Search. In the concluding chapters, this book covers more advanced scenarios such as scalability best practices, serving static content with Azure CDN, and distributing loads with Azure Traffic Manager.
By the end of the book, you will be able to build modern applications on the Azure cloud using the most popular and promising technologies, which will help make your solutions reliable, stable, and efficient.
Table of Contents (24 chapters)
Preface
 Free Chapter
Azure App Service
Azure WebJobs
Deploying Web Applications as Containers
Distributed Applications and Microservices with Service Fabric
Using Azure Search
Mobile Notifications with Notification Hub
Serverless and Azure Functions
Integrating Different Components with Logic Apps
Swiss Army Knife - Azure Cosmos DB
Reactive Architecture with Event Grid
Using Azure Storage - Tables, Queues, Files, and Blobs
Big Data Pipeline - Azure Event Hub
Real-Time Data Analysis - Azure Stream Analytics
Enterprise Integration - Azure Service Bus
Using Application Insights to Monitor Your Applications
SQL in Azure - Azure SQL
Big Data Storage - Azure Data Lake
Scaling Azure Applications
Serving Static Content Using Azure CDN
Distributing Load with Azure Traffic Manager
Tips and Tricks for Azure
Assessments
Other Books You May Enjoy
Customer Reviews