

Debugger statements are an ingenious way to add simple breakpoint-style elements to your code that can be tripped with developer tools in your browser.
- To start with the debugger statements, add the debugger; statement anywhere within your TypeScript code, for example, as soon as you enter the render() function:
public render(): void {
debugger;
$(function(){
alert('hi');
});
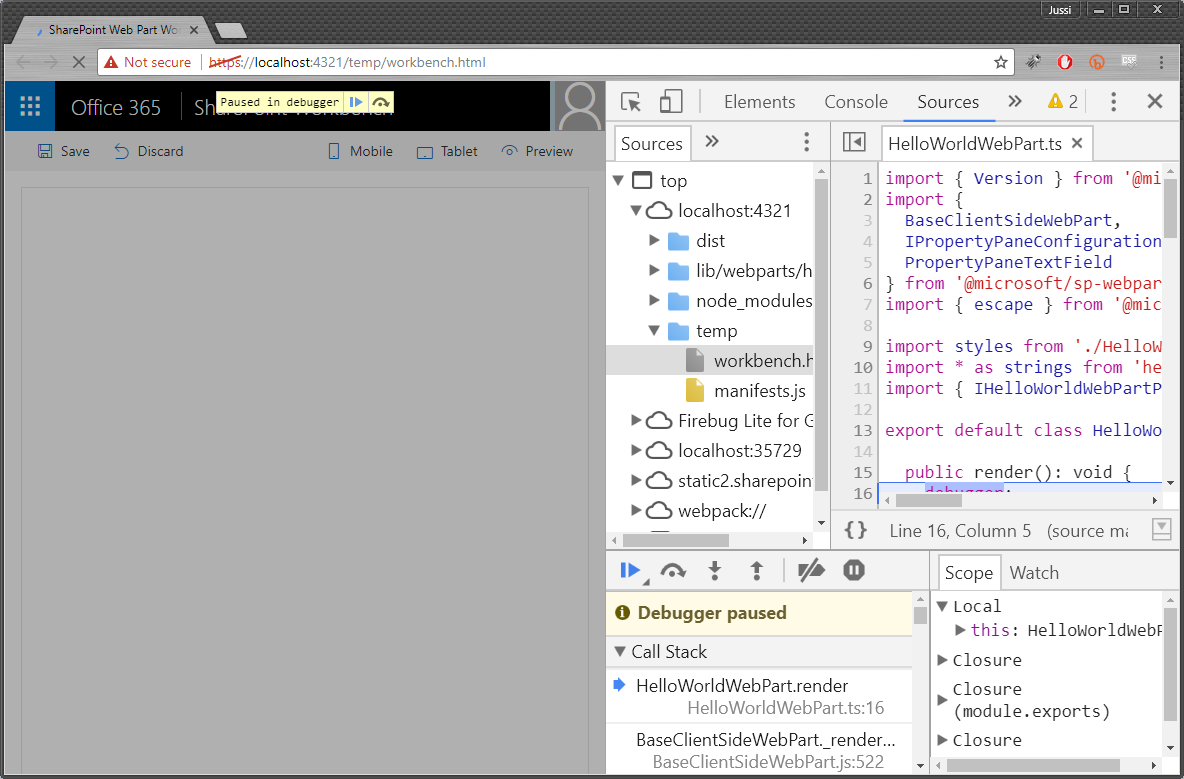
- Run gulp serve to bundle the solution and wait for SharePoint Workbench to load.
- Add the web part on the canvas like you normally would.
- Press Ctrl + Shift + I in Chrome to run Developer Tools.
- Reload the page to trip over the debugger; statement in your code.