Sign In Start Free Trial
Account

Add to playlist

Create a Playlist

Modal Close icon
You need to login to use this feature.
  • Book Overview & Buying Mastering Microsoft Power BI
  • Table Of Contents Toc
  • Feedback & Rating feedback
Mastering Microsoft Power BI

Mastering Microsoft Power BI

By : Powell
3.2 (21)
close
close
Mastering Microsoft Power BI

Mastering Microsoft Power BI

3.2 (21)
By: Powell

Overview of this book

This book is intended for business intelligence professionals responsible for the design and development of Power BI content as well as managers, architects and administrators who oversee Power BI projects and deployments. The chapters flow from the planning of a Power BI project through the development and distribution of content to the administration of Power BI for an organization. BI developers will learn how to create sustainable and impactful Power BI datasets, reports, and dashboards. This includes connecting to data sources, shaping and enhancing source data, and developing an analytical data model. Additionally, top report and dashboard design practices are described using features such as Bookmarks and the Power KPI visual. BI managers will learn how Power BI’s tools work together such as with the On-premises data gateway and how content can be staged and securely distributed via Apps. Additionally, both the Power BI Report Server and Power BI Premium are reviewed. By the end of this book, you will be confident in creating effective charts, tables, reports or dashboards for any kind of data using the tools and techniques in Microsoft Power BI.
Table of Contents (15 chapters)
close
close

Dashboard tiles

Most dashboard tiles are created in the Power BI service by pinning a visual, image, or shape from a report to a new or existing dashboard in the same app workspace. However, dashboard tiles can also be created by adding a tile directly from the dashboard itself and by pinning from an Excel Workbook or an SSRS report.

With a report open in the Power BI service, hovering over the top-right corner of a visual exposes the Pin visual icon, per the following image from the Global Reseller Sales report:

Pin visual icon for report visual

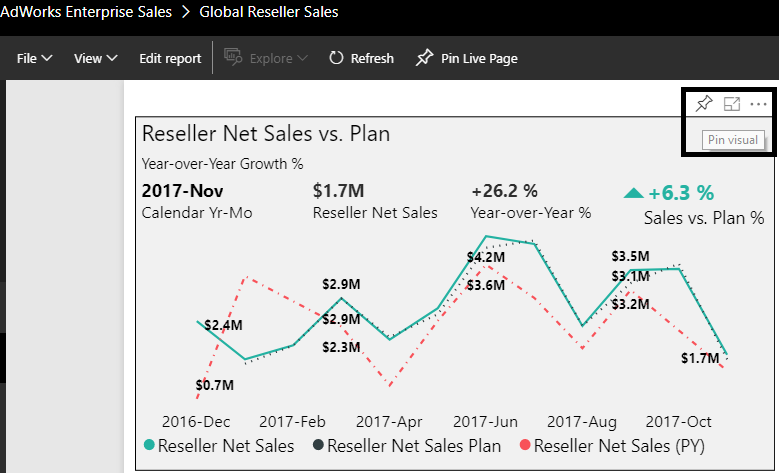
Report visuals can be pinned to dashboards from both the Reading view and the Editing view. The preceding image is from the Reading view, but clicking the Edit report button next to the File and View drop-downs menus opens the Editing view. Reports generally open by default in the Reading view, and the Editing view is only available...

Unlock full access

Continue reading for free

A Packt free trial gives you instant online access to our library of over 7000 practical eBooks and videos, constantly updated with the latest in tech

Create a Note

Modal Close icon
You need to login to use this feature.
notes
bookmark search playlist download font-size

Change the font size

margin-width

Change margin width

day-mode

Change background colour

Close icon Search
Country selected

Close icon Your notes and bookmarks

Delete Bookmark

Modal Close icon
Are you sure you want to delete it?
Cancel
Yes, Delete

Delete Note

Modal Close icon
Are you sure you want to delete it?
Cancel
Yes, Delete

Confirmation

Modal Close icon
claim successful

Buy this book with your credits?

Modal Close icon
Are you sure you want to buy this book with one of your credits?
Close
YES, BUY