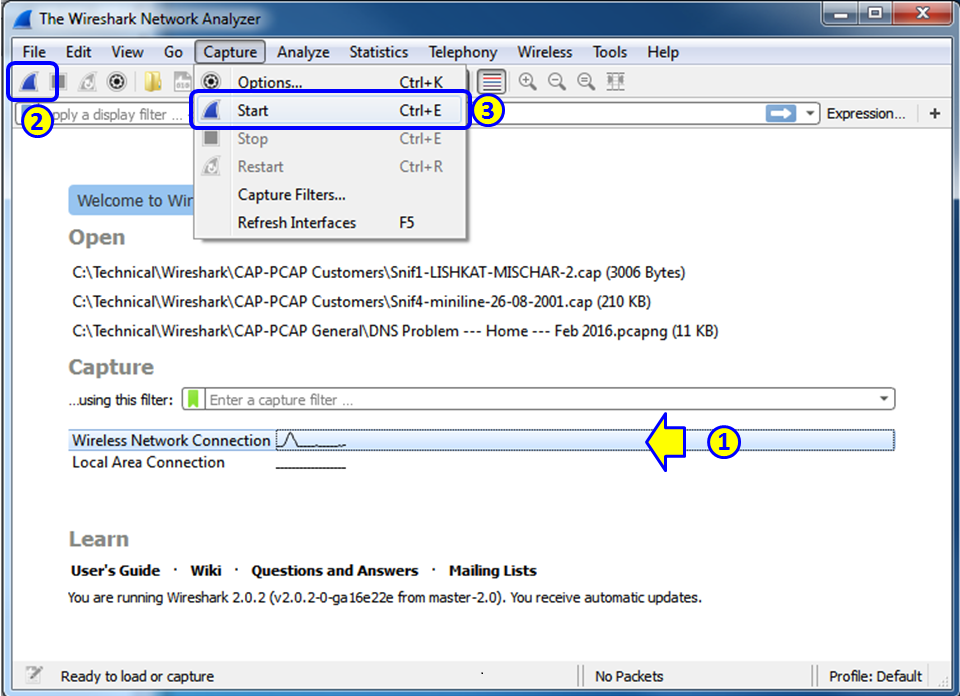
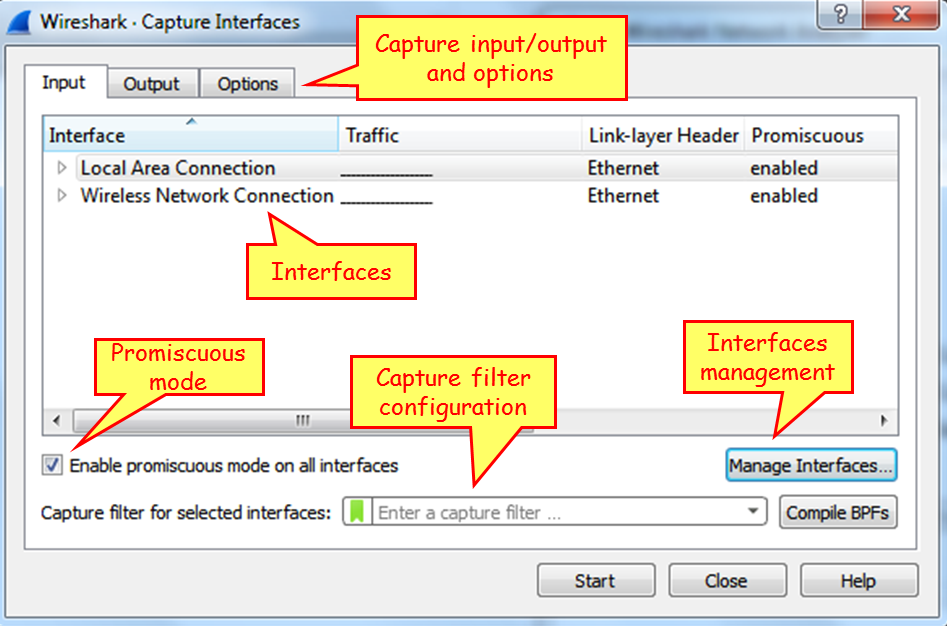
After we have located Wireshark in the network, in this recipe, we will learn how to start capturing data and what we will get in various capture scenarios.
-
Book Overview & Buying

-
Table Of Contents

-
Feedback & Rating

Network Analysis using Wireshark 2 Cookbook
By :
Network Analysis using Wireshark 2 Cookbook
By:
Overview of this book
This book contains practical recipes on troubleshooting a data communications network. This second version of the book focuses on Wireshark 2, which has already gained a lot of traction due to the enhanced features that it offers to users. The book expands on some of the subjects explored in the first version, including TCP performance, network security, Wireless LAN, and how to use Wireshark for cloud and virtual system monitoring. You will learn how to analyze end-to-end IPv4 and IPv6 connectivity failures for Unicast and Multicast traffic using Wireshark. It also includes Wireshark capture files so that you can practice what you’ve learned in the book. You will understand the normal operation of E-mail protocols and learn how to use Wireshark for basic analysis and troubleshooting. Using Wireshark, you will be able to resolve and troubleshoot common applications that are used in an enterprise network, like NetBIOS and SMB protocols. Finally, you will also be able to measure network parameters, check for network problems caused by them, and solve them effectively. By the end of this book, you’ll know how to analyze traffic, find patterns of various offending traffic, and secure your network from them.
Table of Contents (20 chapters)
Preface
 Free Chapter
Introduction to Wireshark Version 2
Mastering Wireshark for Network Troubleshooting
Using Capture Filters
Using Display Filters
Using Basic Statistics Tools
Using Advanced Statistics Tools
Using the Expert System
Ethernet and LAN Switching
Wireless LAN
Network Layer Protocols and Operations
Transport Layer Protocol Analysis
FTP, HTTP/1, and HTTP/2
DNS Protocol Analysis
Analyzing Mail Protocols
NetBIOS and SMB Protocol Analysis
Analyzing Enterprise Applications' Behavior
Troubleshooting SIP, Multimedia, and IP Telephony
Troubleshooting Bandwidth and Delay Issues
Security and Network Forensics
Customer Reviews